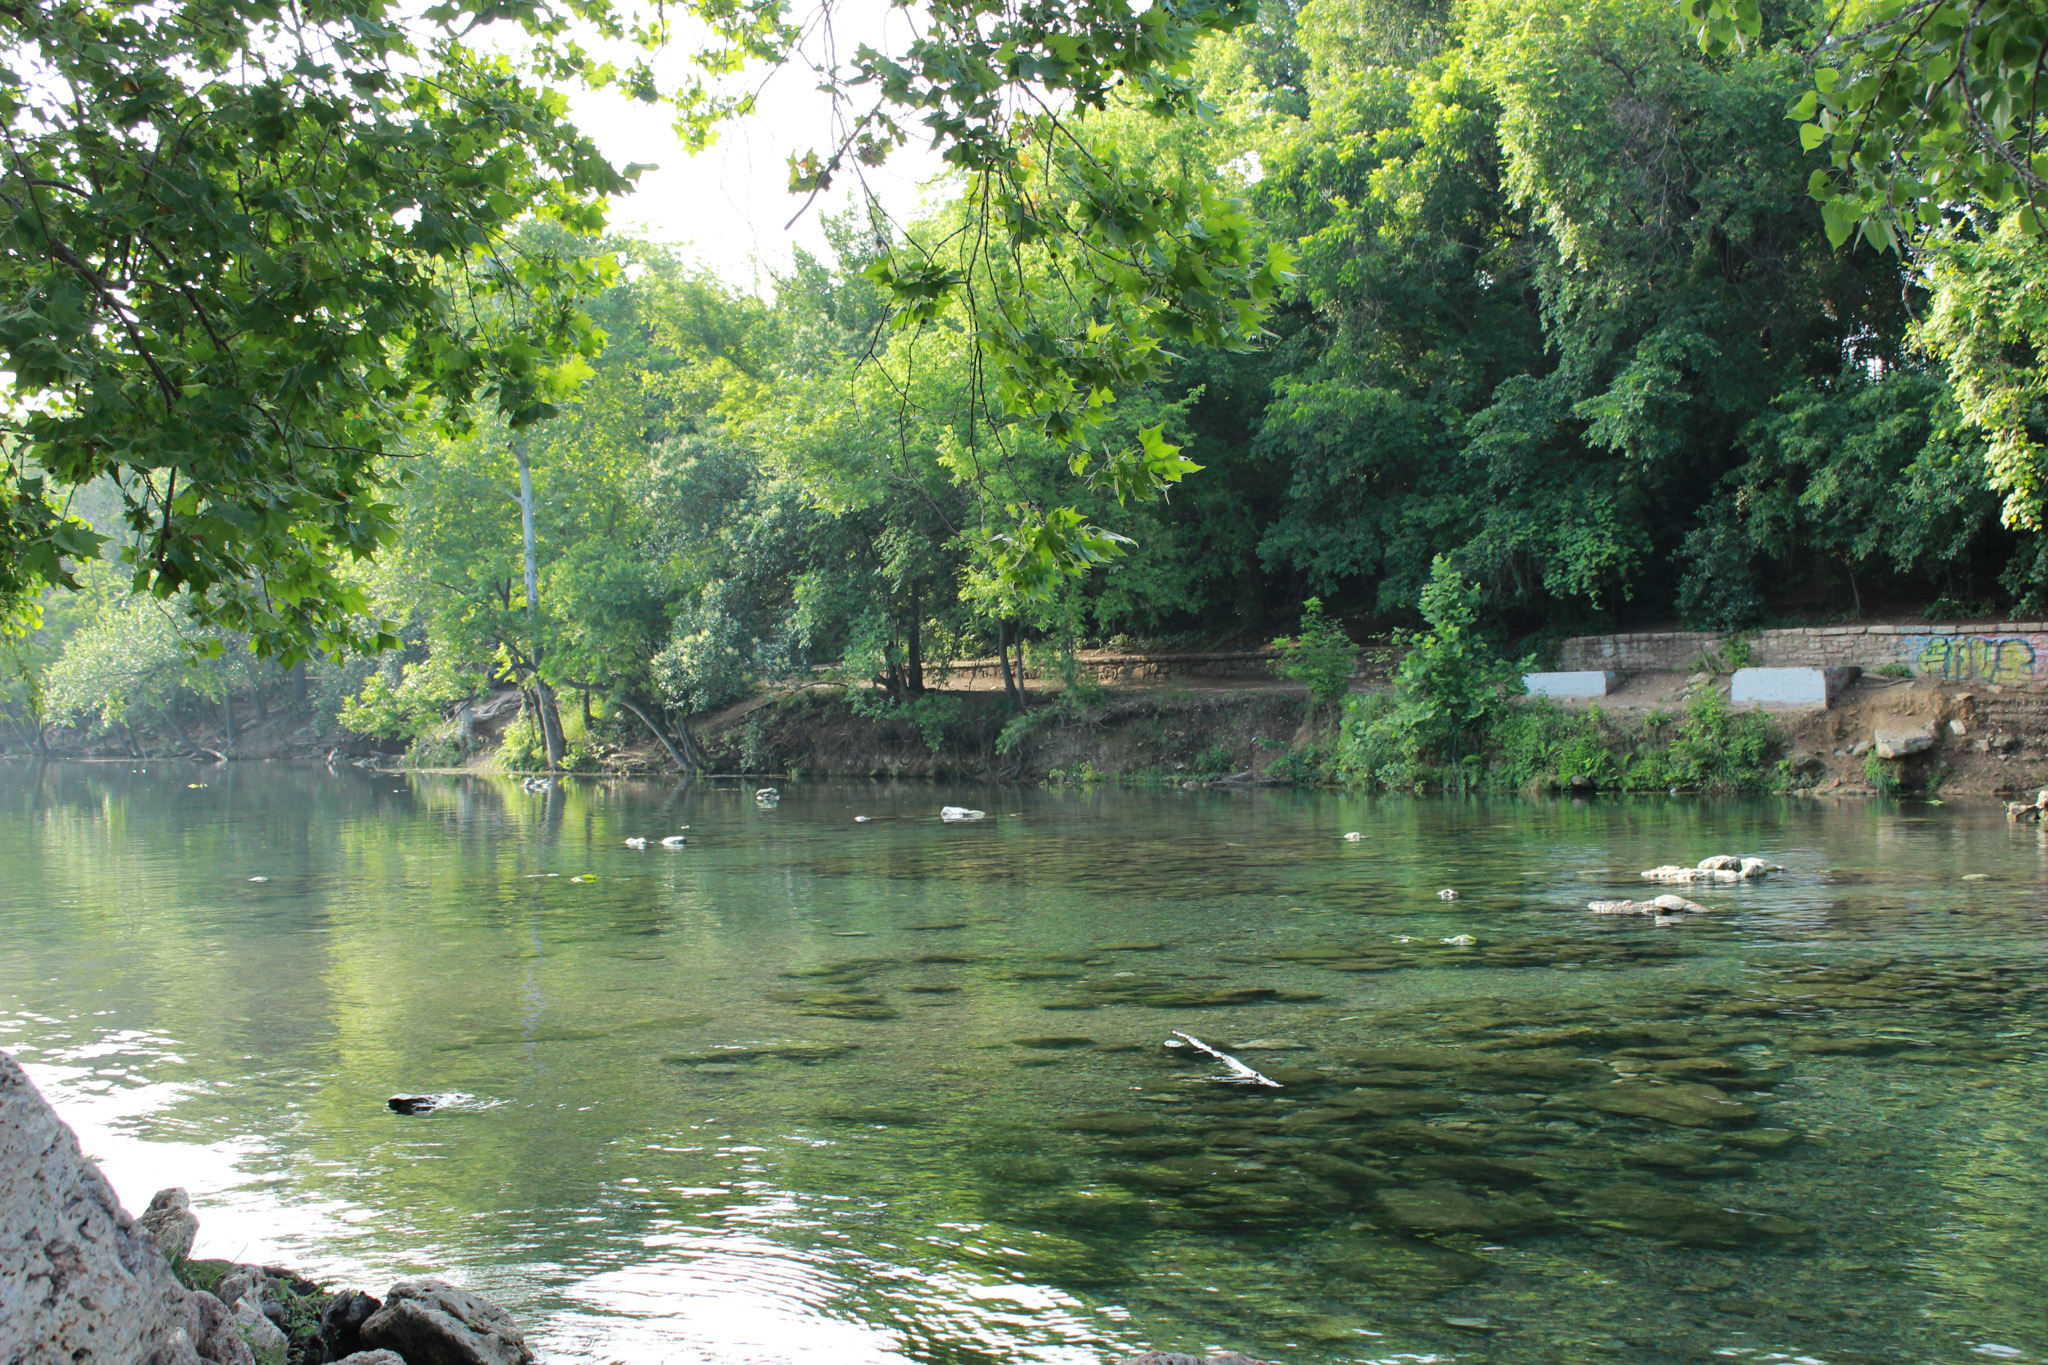
A view of Barton Creek downstream from Barton Springs.
While last June saw a total of 15 triple-digit days, June 27 was Austin’s first 100 degree day of 2024. That’s still a week earlier than the local historical average. A heat dome will remain across Texas throughout this holiday week and result in dry and hot weather across Central and South Texas. Next week brings a chance of storms and a slight reprieve from the intense heat.
Rainfall
This June, the District received an average of 2.5 inches of rainfall, one inch below the historical monthly average of 3.5 inches (figure 1). Tropical Storm Alberto was responsible for an average of 1.8 inches of rainfall in the District. Despite receiving below average rainfall in May and June – two of our wettest months of the year – the District still has a 1.8-inch surplus in precipitation compared to the annual historical average through June.
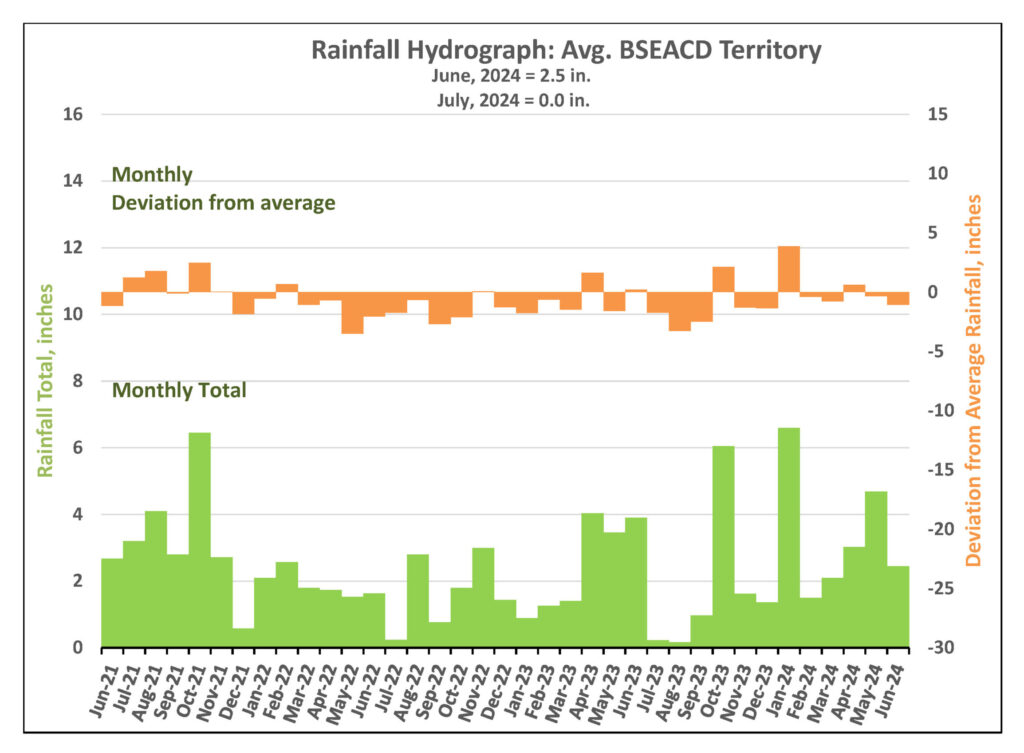
Figure 1. Monthly deviation from average and monthly total rainfall in BSEACD territory.
Groundwater Levels and Springflow
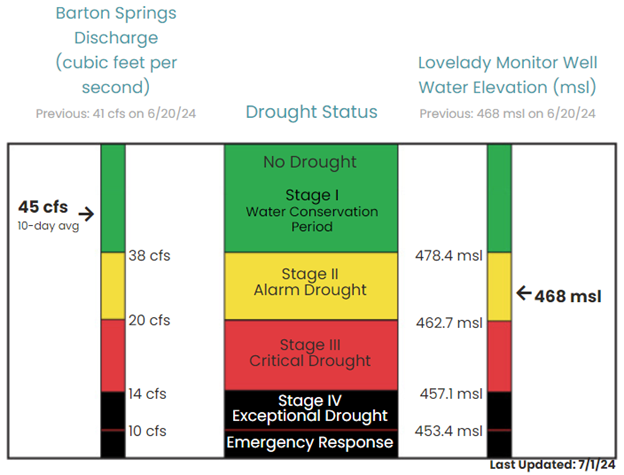
District drought chart showing the 10-day averages for Barton Springs flow and Lovelady monitor well water levels as of July 1, 2024.
Barton Springs
On July 2, the 10-day average flow at Barton Springs is 45 cubic feet per second (cfs), which is still above the Stage II threshold of 38 cfs (figure 2). Similar to May, rains this month contributed to an increase in spring flow, keeping the 10-day average in the mid-40s as we enter the driest season of the year.
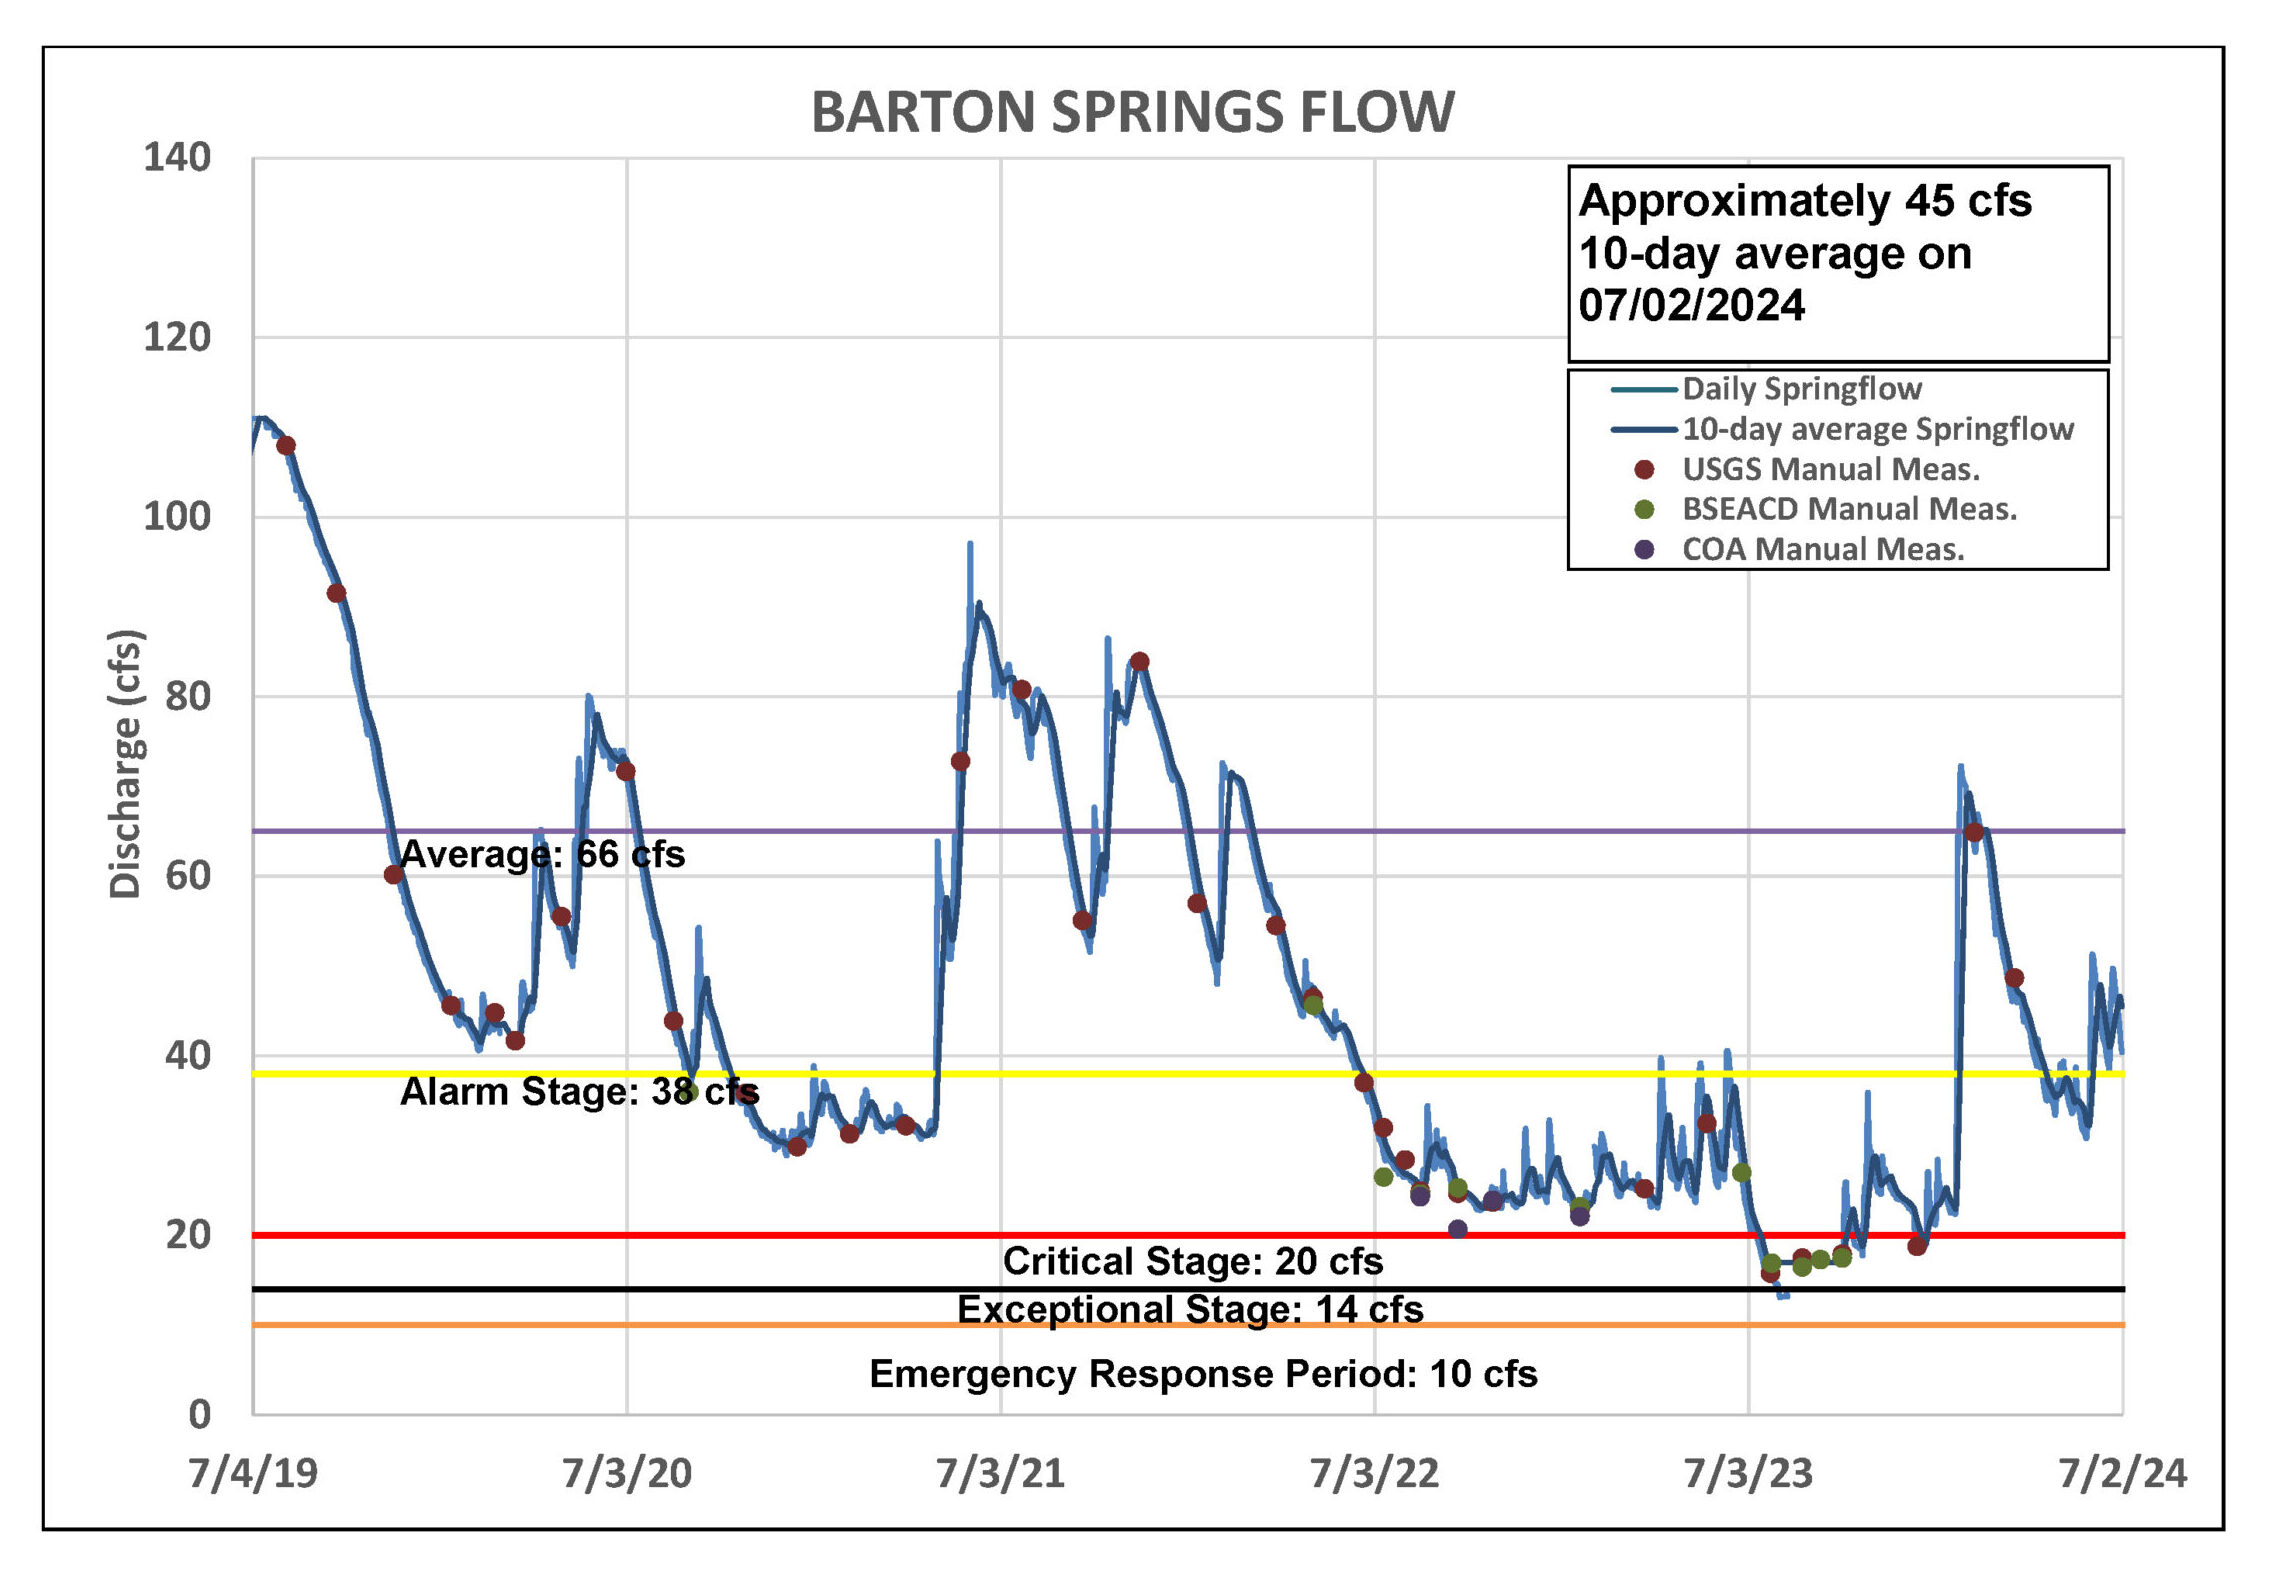
Figure 2. Recorded flow at Barton Springs.
Lovelady Monitor Well
As of July 2, the 10-day average water level at Lovelady stands at 467.9 feet above mean sea level (ft-msl), which is approximately 5 feet above the Stage III Critical Drought status (figure 3). In mid-June we saw a delayed positive response in water levels from the May rains. We anticipate another increase in Lovelady water levels this month in response to rainfall in June.
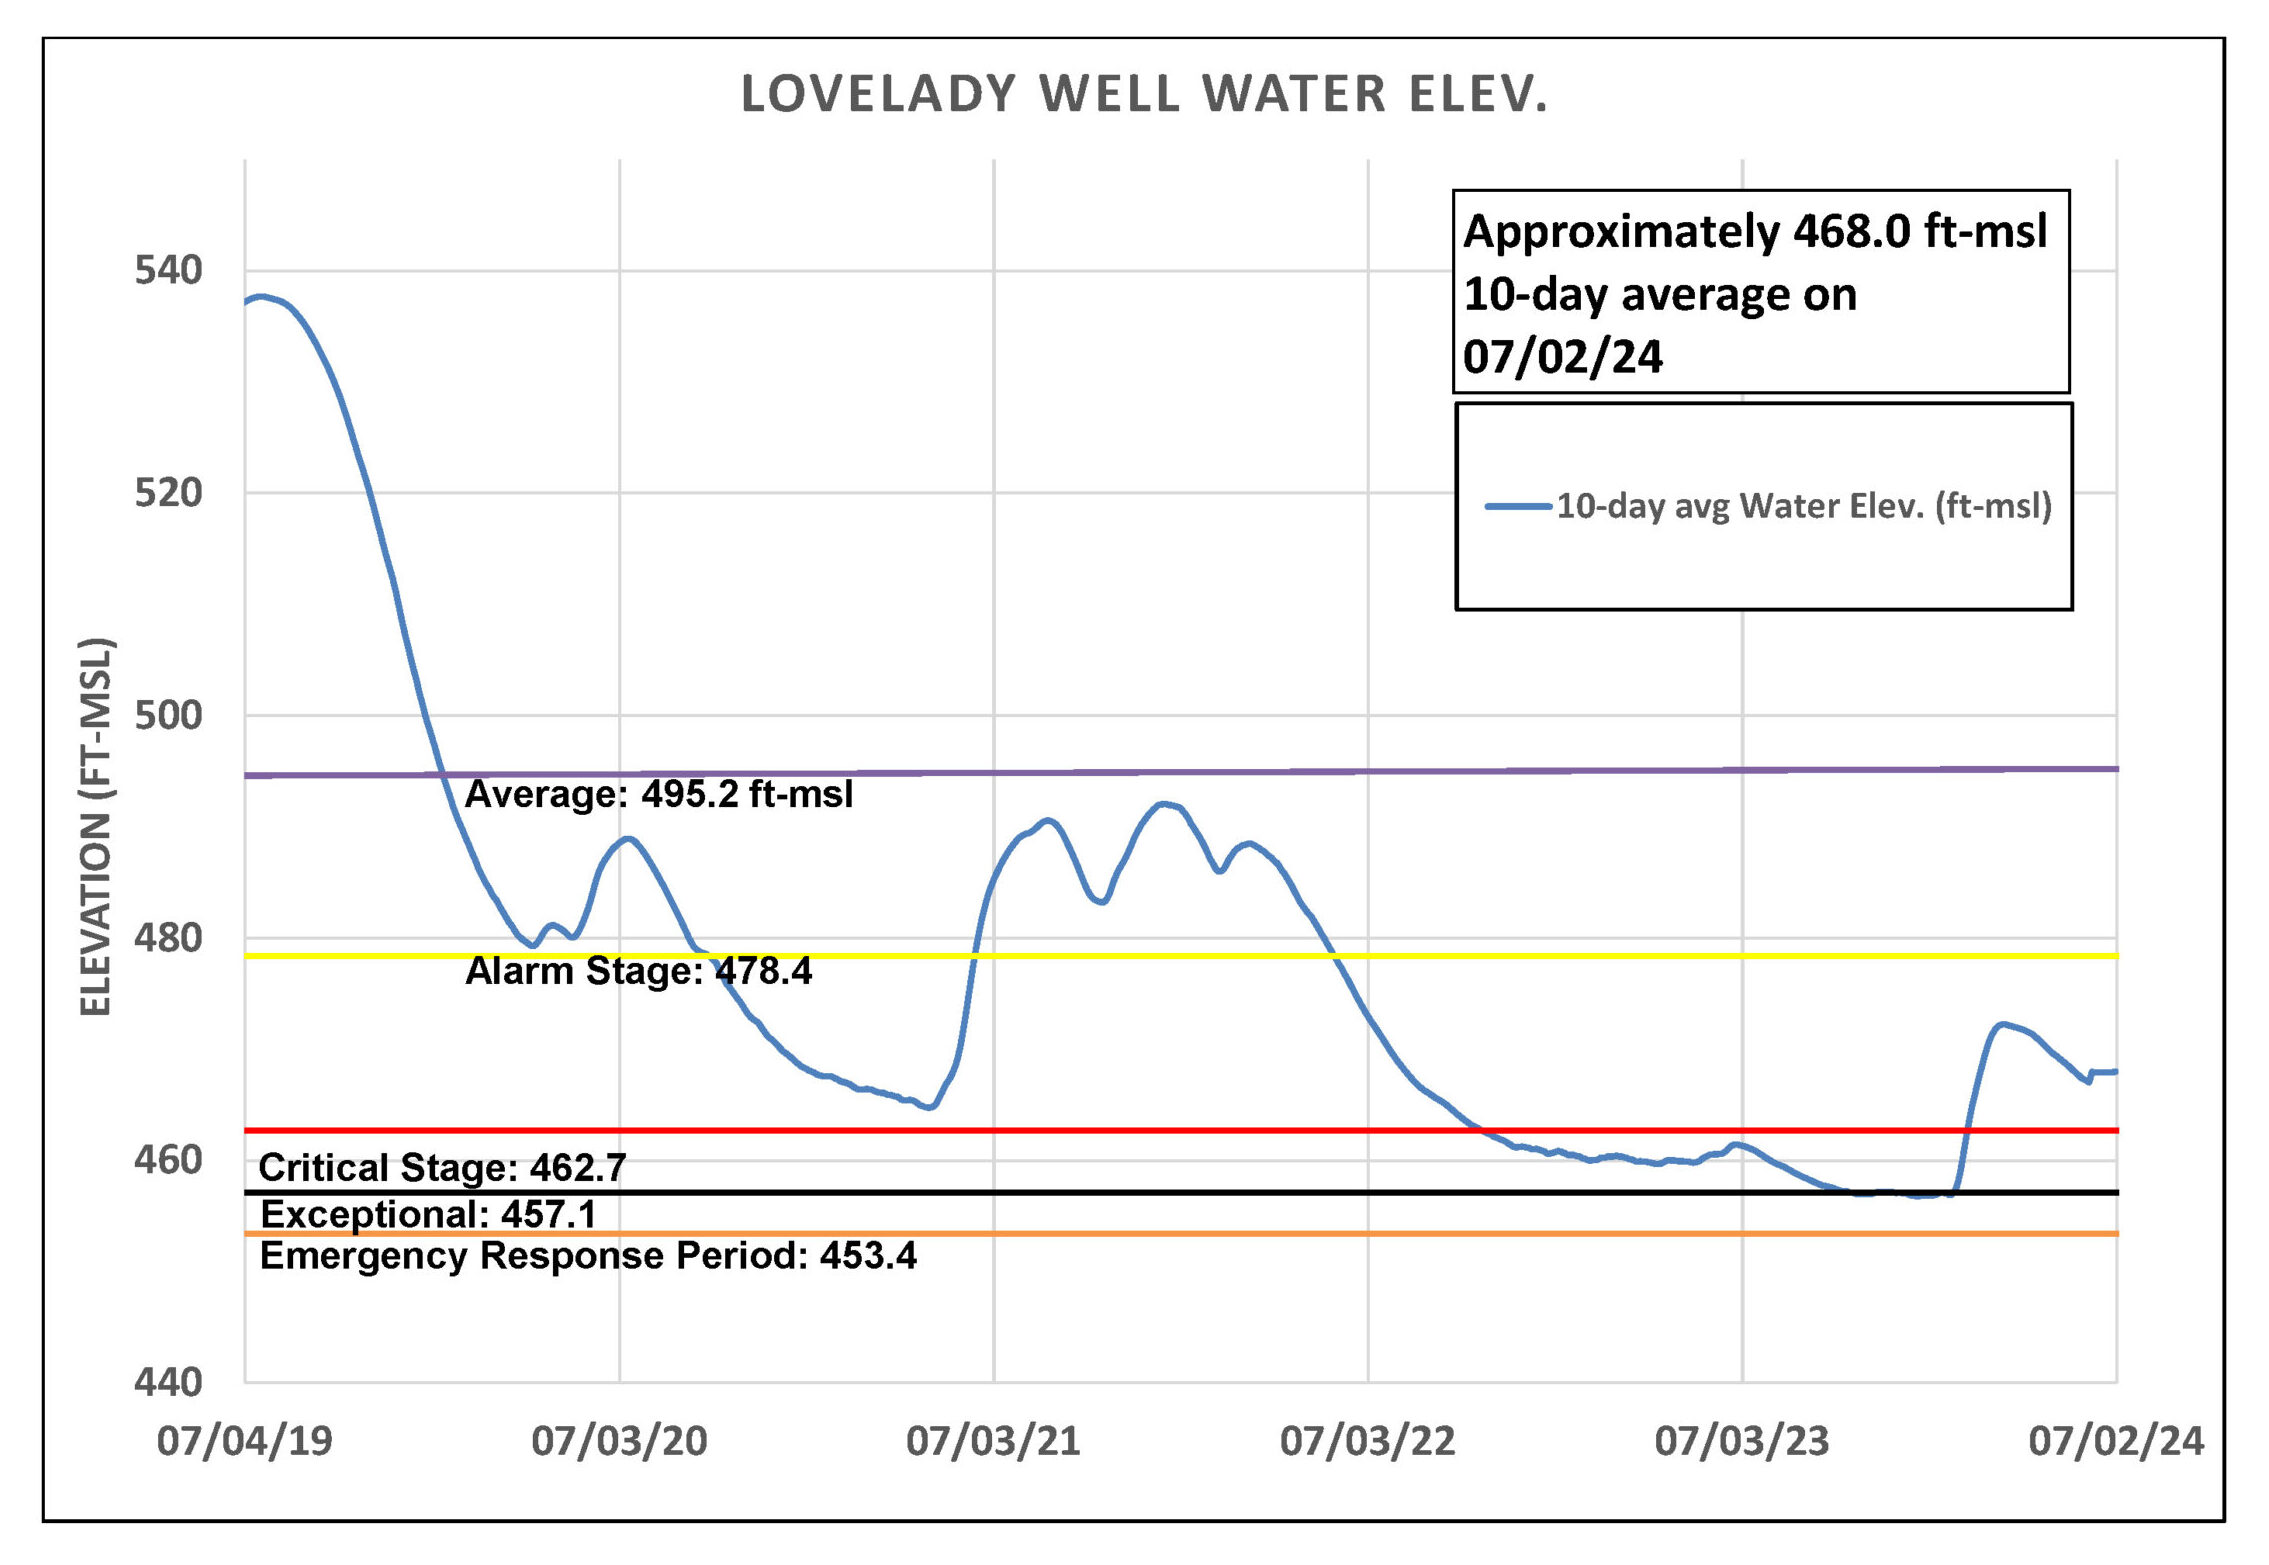
Figure 3. Lovelady monitor well water-level elevation.
Upper and Middle Trinity
As a result of May and June rains, water levels in the Upper Trinity (green) have shown a sharp positive response. Levels experienced a recharge surge of 20 feet (figure 4). In contrast, since late March, the Middle Trinity (purple) has maintained a more subdued pattern and showed only a subtle decline in late April.
Jacob’s Well Spring (JWS) showed more improvement after June rainfall, maintaining an average flow of 3 cfs for the month. This is notable as JWS reported zero cfs for all the summer of 2023. The Blanco River at Wimberley experienced several small surges in June, reaching a peak flow of 142 cfs on June 10. The current flow is now in the low teens.
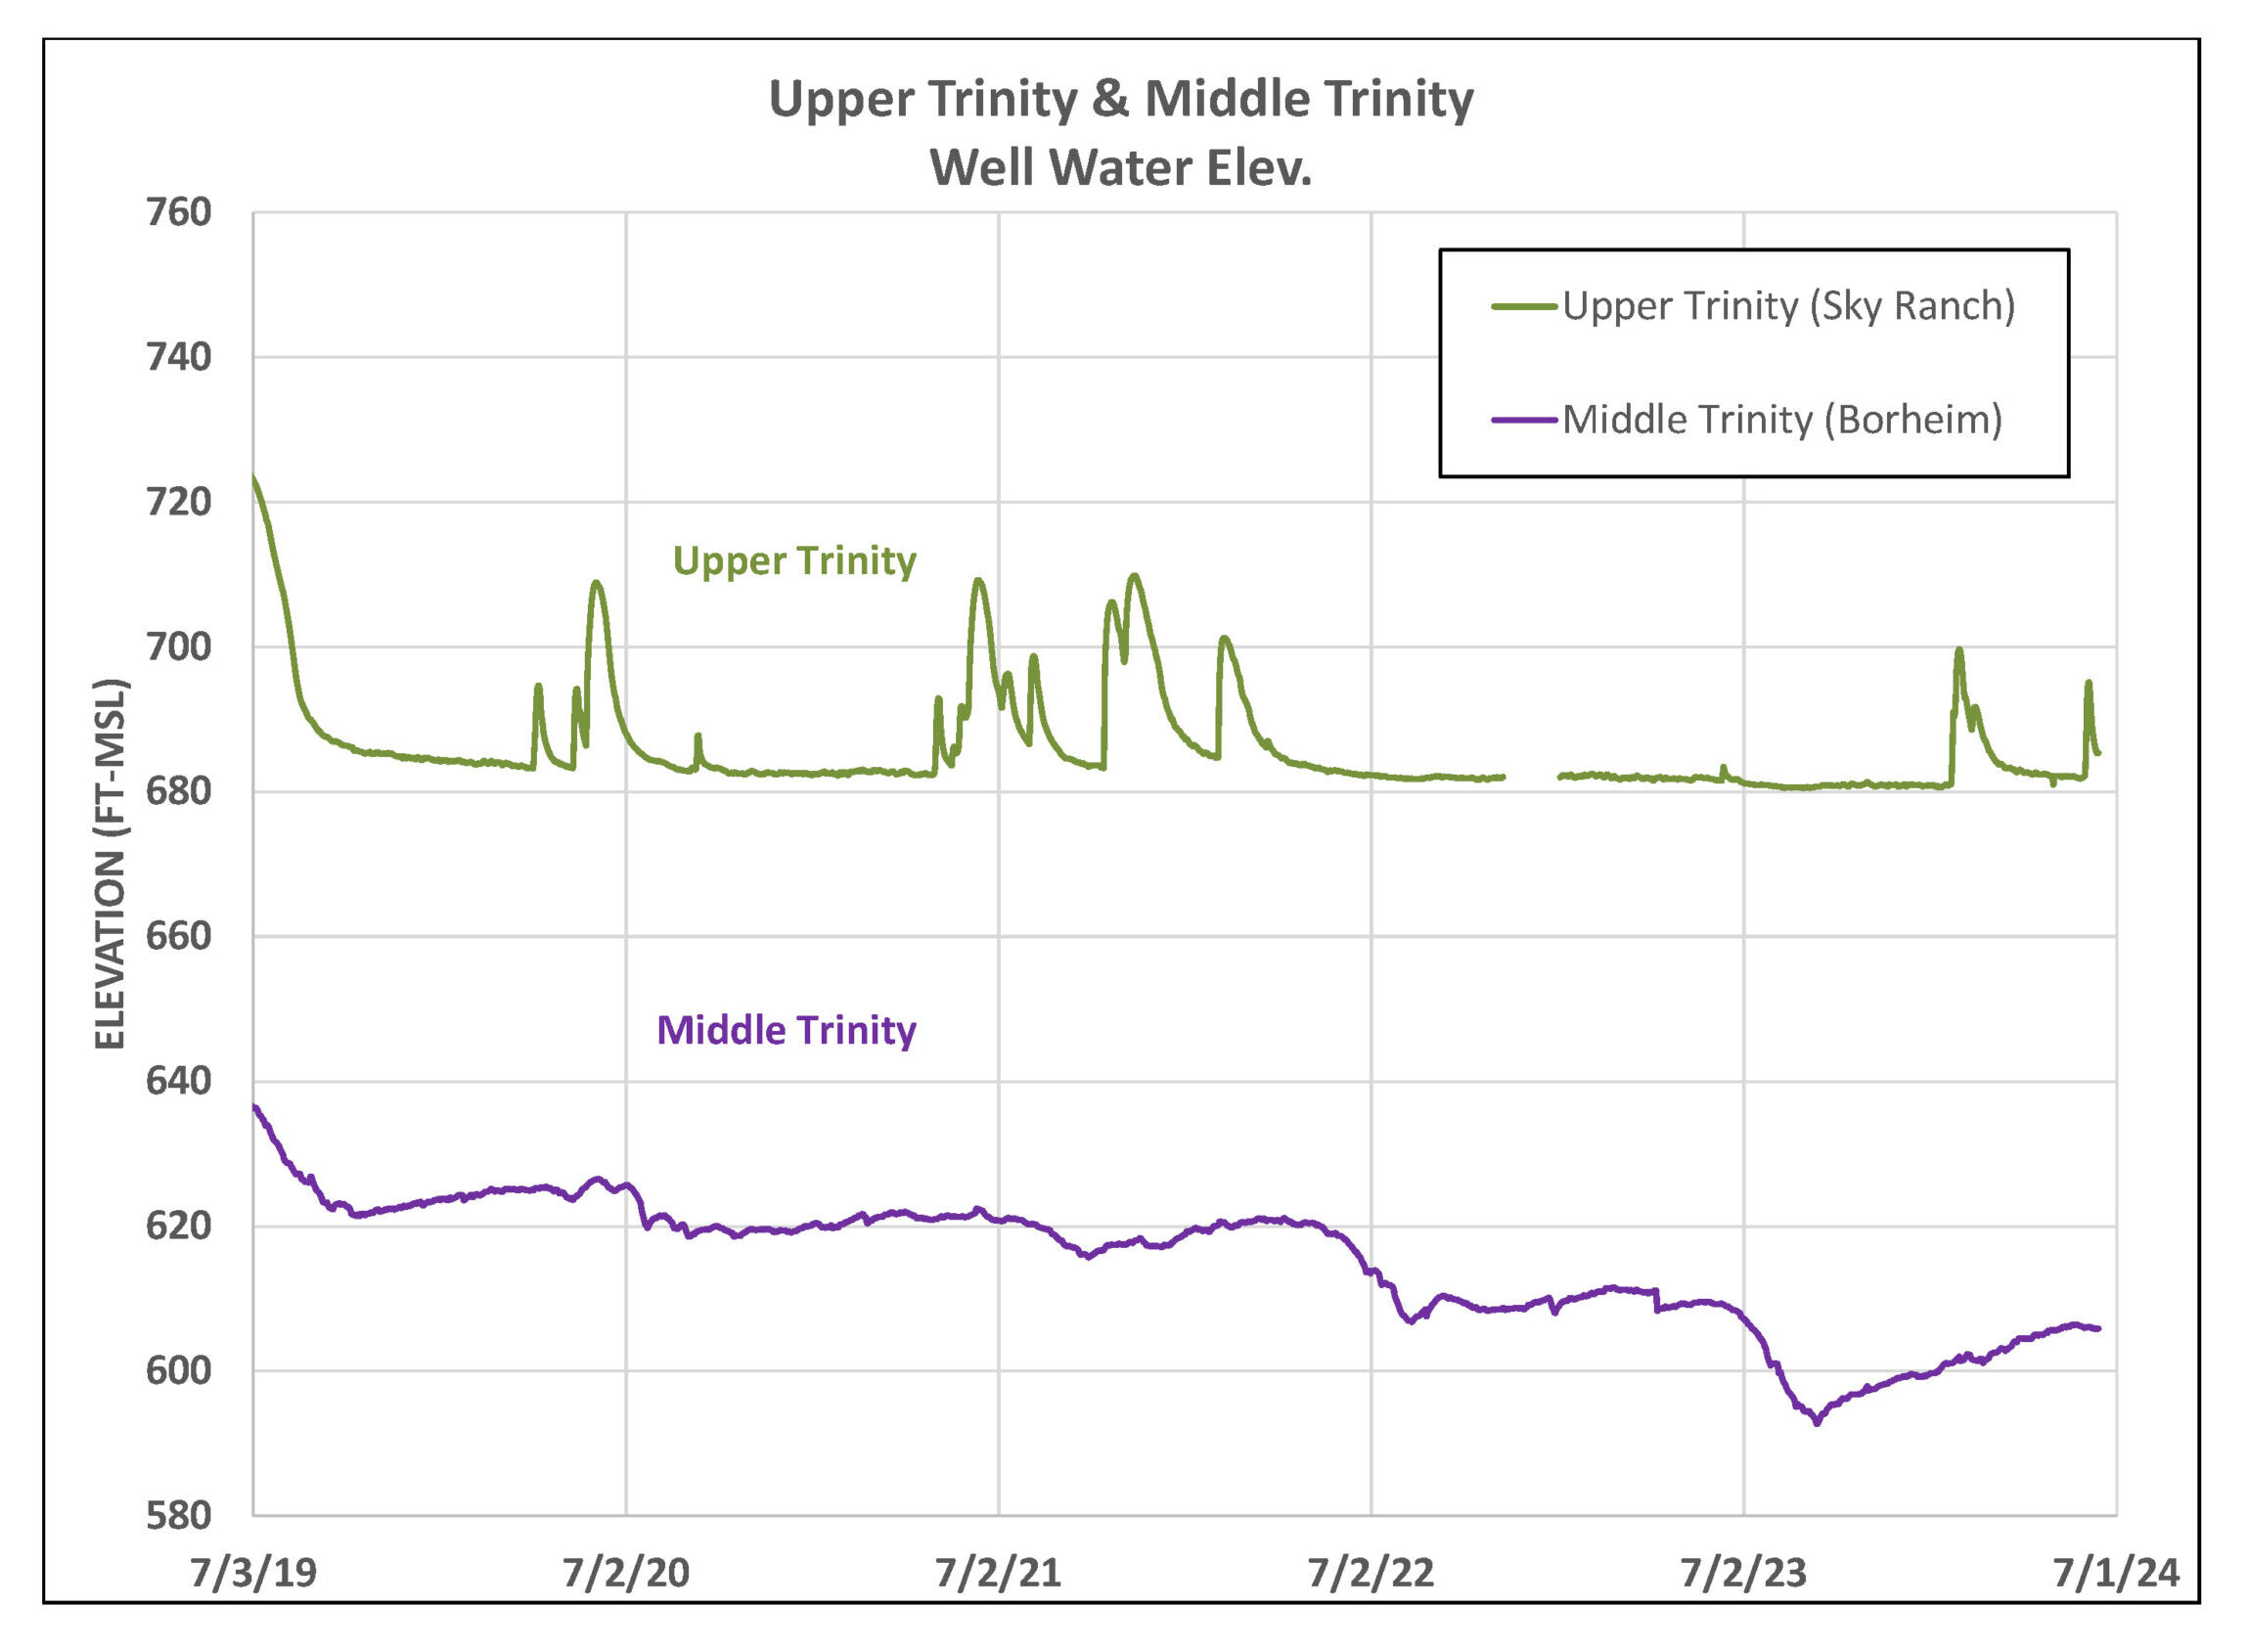
Figure 4. Water levels in an Upper Trinity well (green) and Middle Trinity well (purple).
Highland Lakes
Over the last month, Lake Buchanan has gone up from 72% to 73% full while Lake Travis has remained at 42%. Combined, the lakes are sitting at 56% full going into the heat of summer. With the upcoming months being the area’s hottest, driest, and most water-use intensive times, we can anticipate these levels to decline over the upcoming weeks.
Forecast
July is usually the second driest and second hottest month of the year. While this month is projected to be hotter than average, there are equal chances for above-below-or near normal precipitation (which is historically under 2 inches).
Conservation
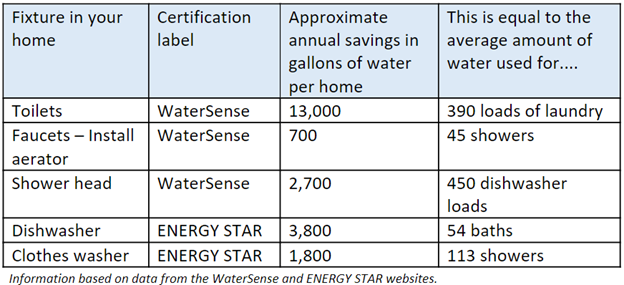
Conservation: WaterSense and ENERGY STAR fixtures
A big way you can conserve water indoors and save money is to replace older fixtures in your home with WaterSense or ENERGY STAR labeled options. These certifications meet the federal governments’ specifications for efficiency and performance. Even if you’re unable to replace larger fixtures at this time, you can purchase a WaterSense showerhead for as little as $20 and aerators for $5.
Check out the chart below to see how much water you could save by switching to these water efficient fixtures.