The District’s Aquifer Science Team monitors over 50 wells across our region to understand hydrologic relationships of recharge and discharge within the Edwards and Trinity aquifers. The monitoring well network is a partnership between well owners and local, state, and federal agencies to enhance understanding of groundwater throughout the Texas Hill Country.
Long-term systematic measurements of water levels are essential for the District’s drought management, conservation program, and hydrogeological studies.
Types of Monitor Wells

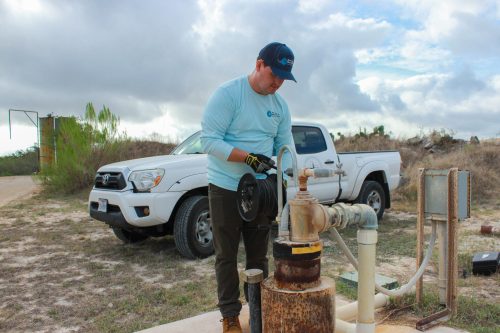
District staff measuring a periodic monitor well using an e-line.
Periodic Monitor Wells
The District’s periodic monitor wells include unused and domestic wells that have historical water level measurements. Manual measurements are obtained using an e-line or electric tape.
Depth-to-water measurements are useful when the depth of the pump and/or total well depth is known because the amount of water above the pump or in the water column can be calculated. Well measurements make it possible to compare water levels at multiple wells at various locations to track regional aquifer trends.
Multiport Monitor Wells
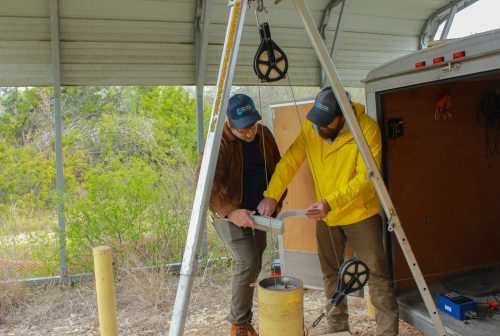
The District has nine multiport wells, which are sophisticated periodic monitor wells. The multiport wells allow multiple zones within a single borehole to be measured. More than 80 zones are monitored with a specialized winch and pressure transducer system. Data collected include water levels, water quality, and permeability tests from isolated zones of the aquifers.

Staff members collecting data from a District multiport monitor well near Buda.

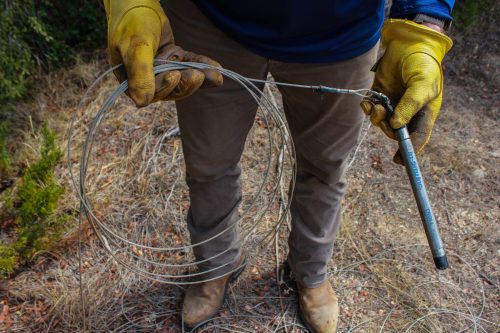
A close up of a pressure transducer and line.
Continuous Measurement Wells
The District collects continuous data at over 30 wells. This information is collected by a piece of equipment called a pressure transducer, which measures the weight of water and converts the measurement into a water depth at least every hour.
The District’s continuous measurement wells are telemetered and transmit the water level measurements to a publicly accessible website. The pressure transducers in the other wells are visited quarterly, and the data is manually downloaded, processed, and reviewed. These transducers are calibrated and verified using periodic manual water measurements made with an e-line or electric tape.
Monitoring Sites & Gauges of Interest
This interactive map shows monitor wells, stream gauges, and weather station within and nearby the District’s territory.
Current and Historical Conditions
Click on each of the titles below to see a variety of relevant and real-time and historical resources related to water and weather conditions in the Texas Hill Country and beyond.
The USGS has real-time gauge monitors on the Districts two drought determinants: Barton Springs flow and Lovelady monitor well groundwater levels. Additionally, to ensure accuracy, the District manually measures both of these sites to calibrate the gauges. Below are links to real-time measurements of both sites. You can learn more about how the District manages drought at www.bseacd.org/droughtinfo.
Barton Springs Flow
Lovelady Monitor Well
Streamflow is an important indicator of both surface and groundwater levels. The District regularly tracks streamflow and springflow to monitor recharge and discharge of water resources. Below are USGS real-time monitors for gauges throughout, and nearby, the District’s territory.
Onion Creek
Upstream of Recharge Zone- Onion Creek near Driftwood, Texas
Downstream of Recharge Zone – Onion Creek at Twin Creeks Road near Manchaca, Texas
Bear Creek
Upstream of Recharge Zone – Bear Creek below FM 1826 near Driftwood, Texas
Downstream of Recharge Zone – Bear Creek near Brodie Lane near Manchaca, Texas
Slaughter Creek
Upstream of Recharge Zone – Slaughter Creek at FM 1826 near Austin, Texas
Downstream of Recharge Zone – Slaughter Creek at FM 2304 near Austin, Texas
Williamson Creek
Upstream of Recharge Zone – Williamson Creek at Oak Hill, Texas
Downstream of Recharge Zone – Williamson Creek at Manchaca Road, Austin, Texas
Barton Creek
Upstream of Recharge Zone – Barton Creek at Lost Creek Boulevard, Austin, Texas
In the Recharge Zone – Barton Creek at Loop 360, Austin, Texas
In the Recharge Zone – Barton Creek above Barton Springs, Austin, Texas
All USGS Gauges within the District Boundaries
Real-Time Current Conditions for Texas
These maps show real-time conditions of water resources throughout the state of Texas.
USGS Water Dashboard
Here you’ll find a map that shows USGS gauges, National Weather Service rain gauges, and more.
TexasFlood.org
This resource shows real-time flooding stages throughout the state of Texas. It’s hosted by the Texas Water Development Board.
TexMesonet
This map displays current weather conditions across the state and is hosted by the Texas Water Development Board.
WunderMap
Here is an interactive map showing current radar and stream flow data on a Google Maps viewer.
LCRA Hydromet
This map displays surface water flow, water quality, rainfall, and weather data for the Colorado River Basin.
Hays County WETMap
This emergency services flood map shows the status of road crossings throughout Hays County.
Water Data Interactive
Texas Water Development Board maintains both groundwater water quality and submitted well drillers reports in an interactive map interface.
Automated Groundwater Level Map
This map generated by the Texas Water Development Board provides real-time recorder wells with links to text files and graphs.
Weather conditions directly impact groundwater levels. Here you can find resources on weather conditions in the District and throughout Texas.
Weather Station at District Headquarters
This shows data collected by the HOBO Station located at District Headquarters in Manchaca, Texas.
Texas A&M Climatic Data
Here you’ll find historical climate data for all of Central Texas.
TexMesonet
The TexMesonet provides comprehensive, real-time weather data for the state of Texas.
Hays-Trinity Groundwater Levels for Texas
HTGCD collects water level and precipitation data for multiple wells included in this map. Water level data is compiled from the measurements made by district field technicians while precipitation data is gathered from the National Oceanic and Atmospheric Administration.
USGS Groundwater Levels for Texas
This is a table full of sites that provide real-time and/or historical water levels from wells across Texas.
This database is interactive and serves as a viewing and well database tool.
Aquifer Research
Learn more about other ways the District continuously studies the Edwards and Trinity aquifers.
