On average, January is the area’s coldest month of the year, which rang true for 2025. Camp Mabry recorded an average temperature of 46.9°F throughout the month—5.3° below normal. Last month tied for the 23rd coldest January on record for the Austin area. This is a stark change from the region experiencing its warmest meteorological fall on record toward the end of 2024.
Rainfall
While January 2024 brought above average rainfall (totaling 6.6 inches), January 2025 was significantly drier (Figure 1). The District received an average of 1.6 inches of precipitation, which is 1 inch below average. Less than an inch of this resulted from graupel, sleet, and snow that fell January 20-21. According to KXAN, it was the “snowiest day in Austin since February 15th, 2021.”
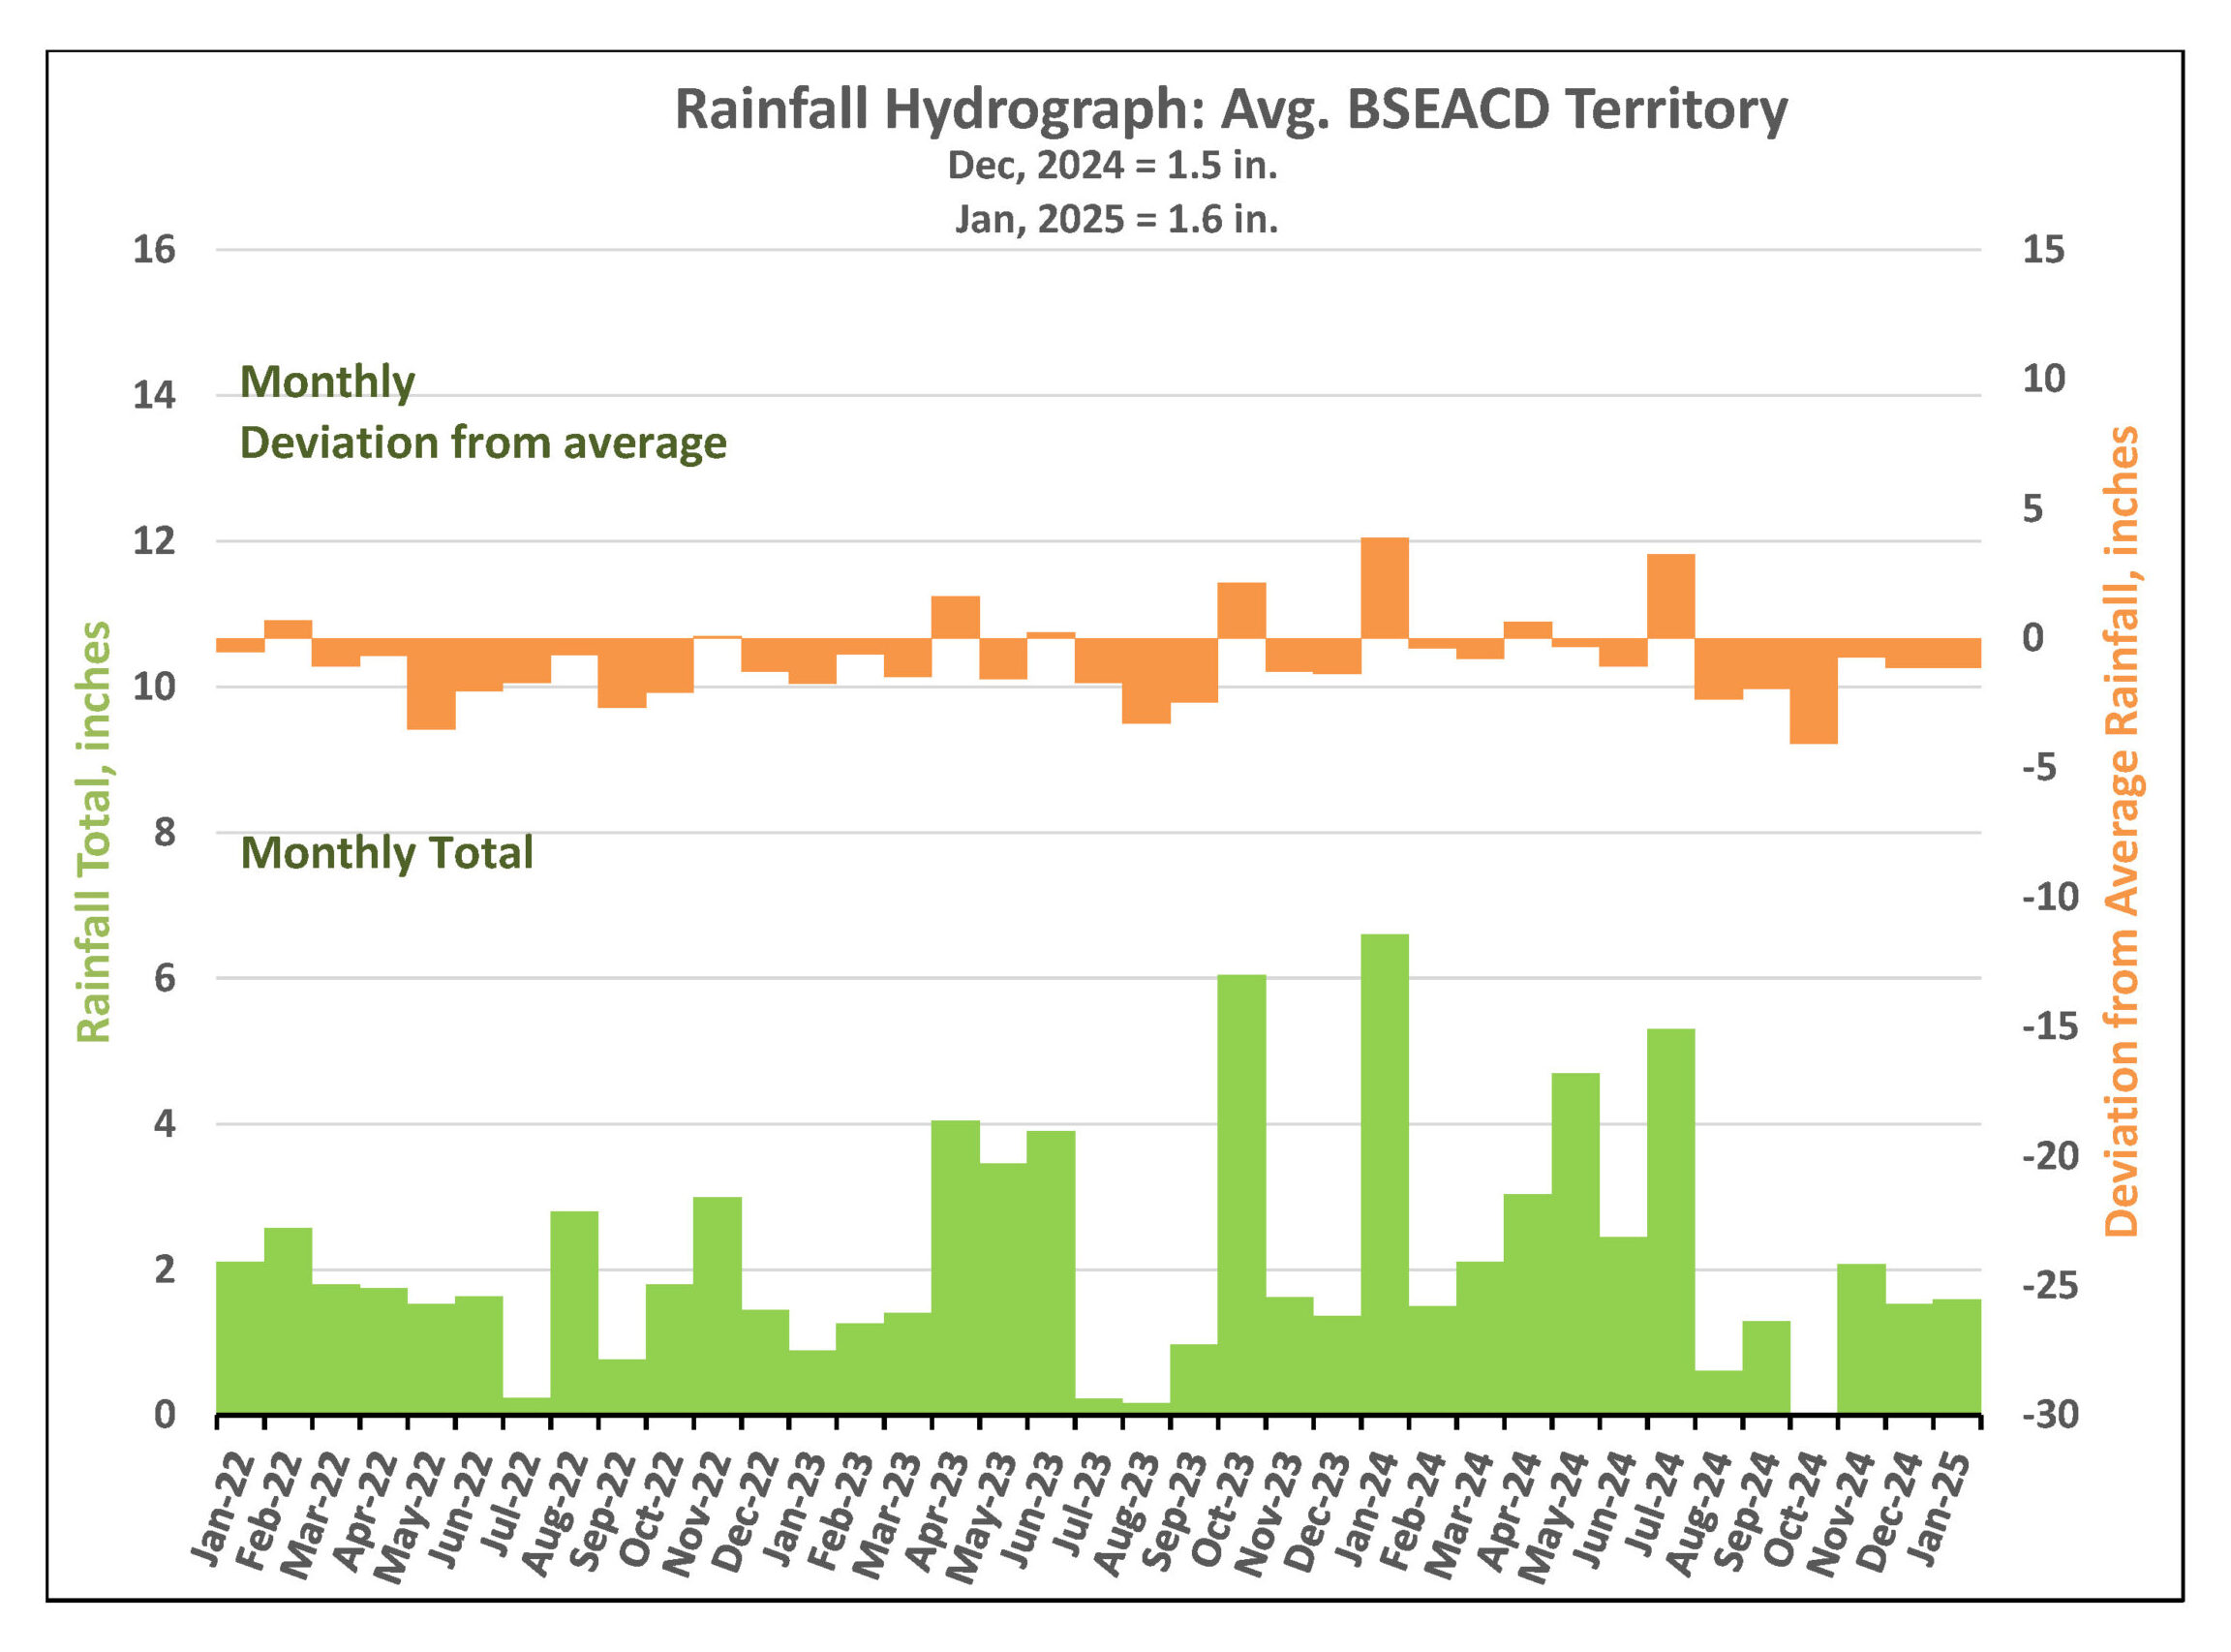
Figure 1. Monthly deviation from average and monthly total rainfall in District’s territory.
Drought Triggers and Status
Barton Springs Flow
As of February 6, the 10-day average flow at Barton Springs is 15.6 cubic feet per second (cfs) (Figure 2). This value is based on the most recent manual measurement taken by District staff on January 24, 2025. Since then, approximately 0.8 inches of rainfall has fallen across the District, likely increasing spring flow by a few cfs.
Due to recent maintenance inside the pool and other unknown factors that may be affecting the accuracy of the USGS real-time gauge, staff will conduct biweekly manual measurements to closely monitor any potential progression into a deeper drought stage. The next measurement is scheduled for February 12 to inform the Board meeting on February 13.
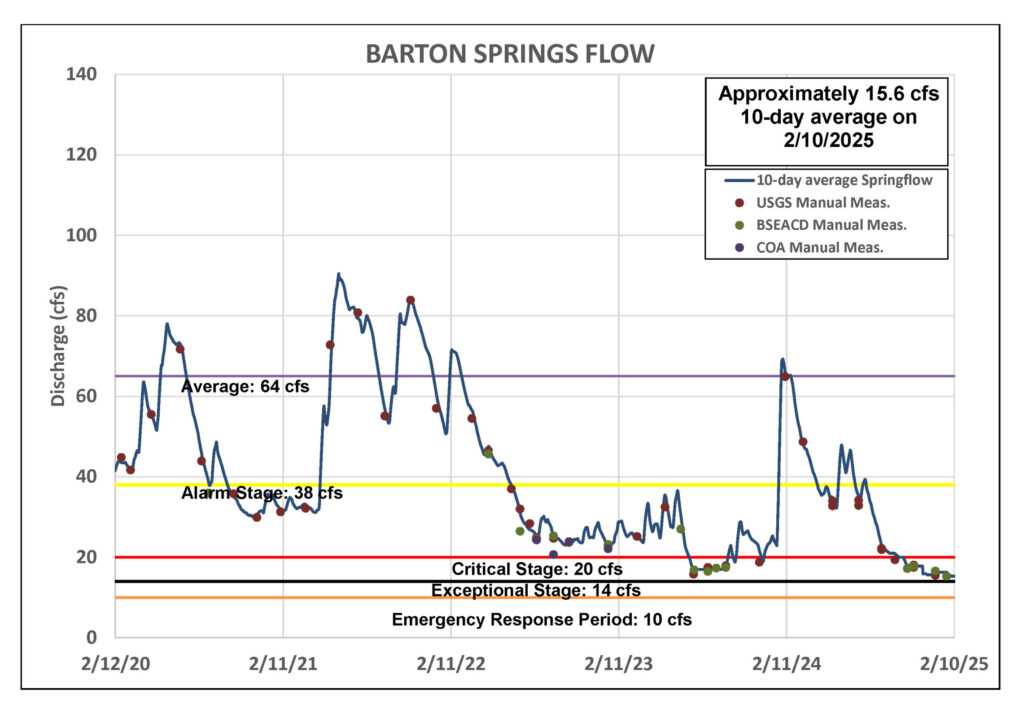
Figure 2. Barton Springs flow for the last five years.
Lovelady Monitor Well
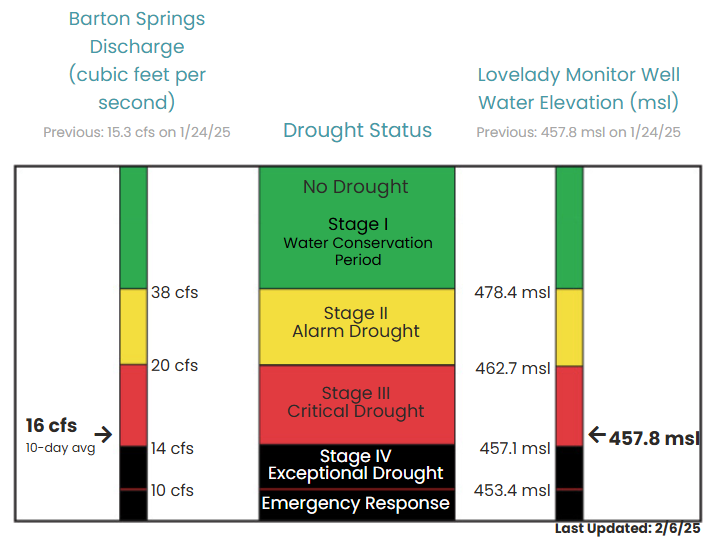
On February 6, the 10-day average water level at the Lovelady monitor well was recorded at 457.8 feet above mean sea level (ft-msl), placing it within the District’s Stage III threshold and approximately 1.2 feet above the Stage IV Exceptional Drought threshold (Figure 3). Without rain we could see water levels at Lovelady dip into Stage IV next month.
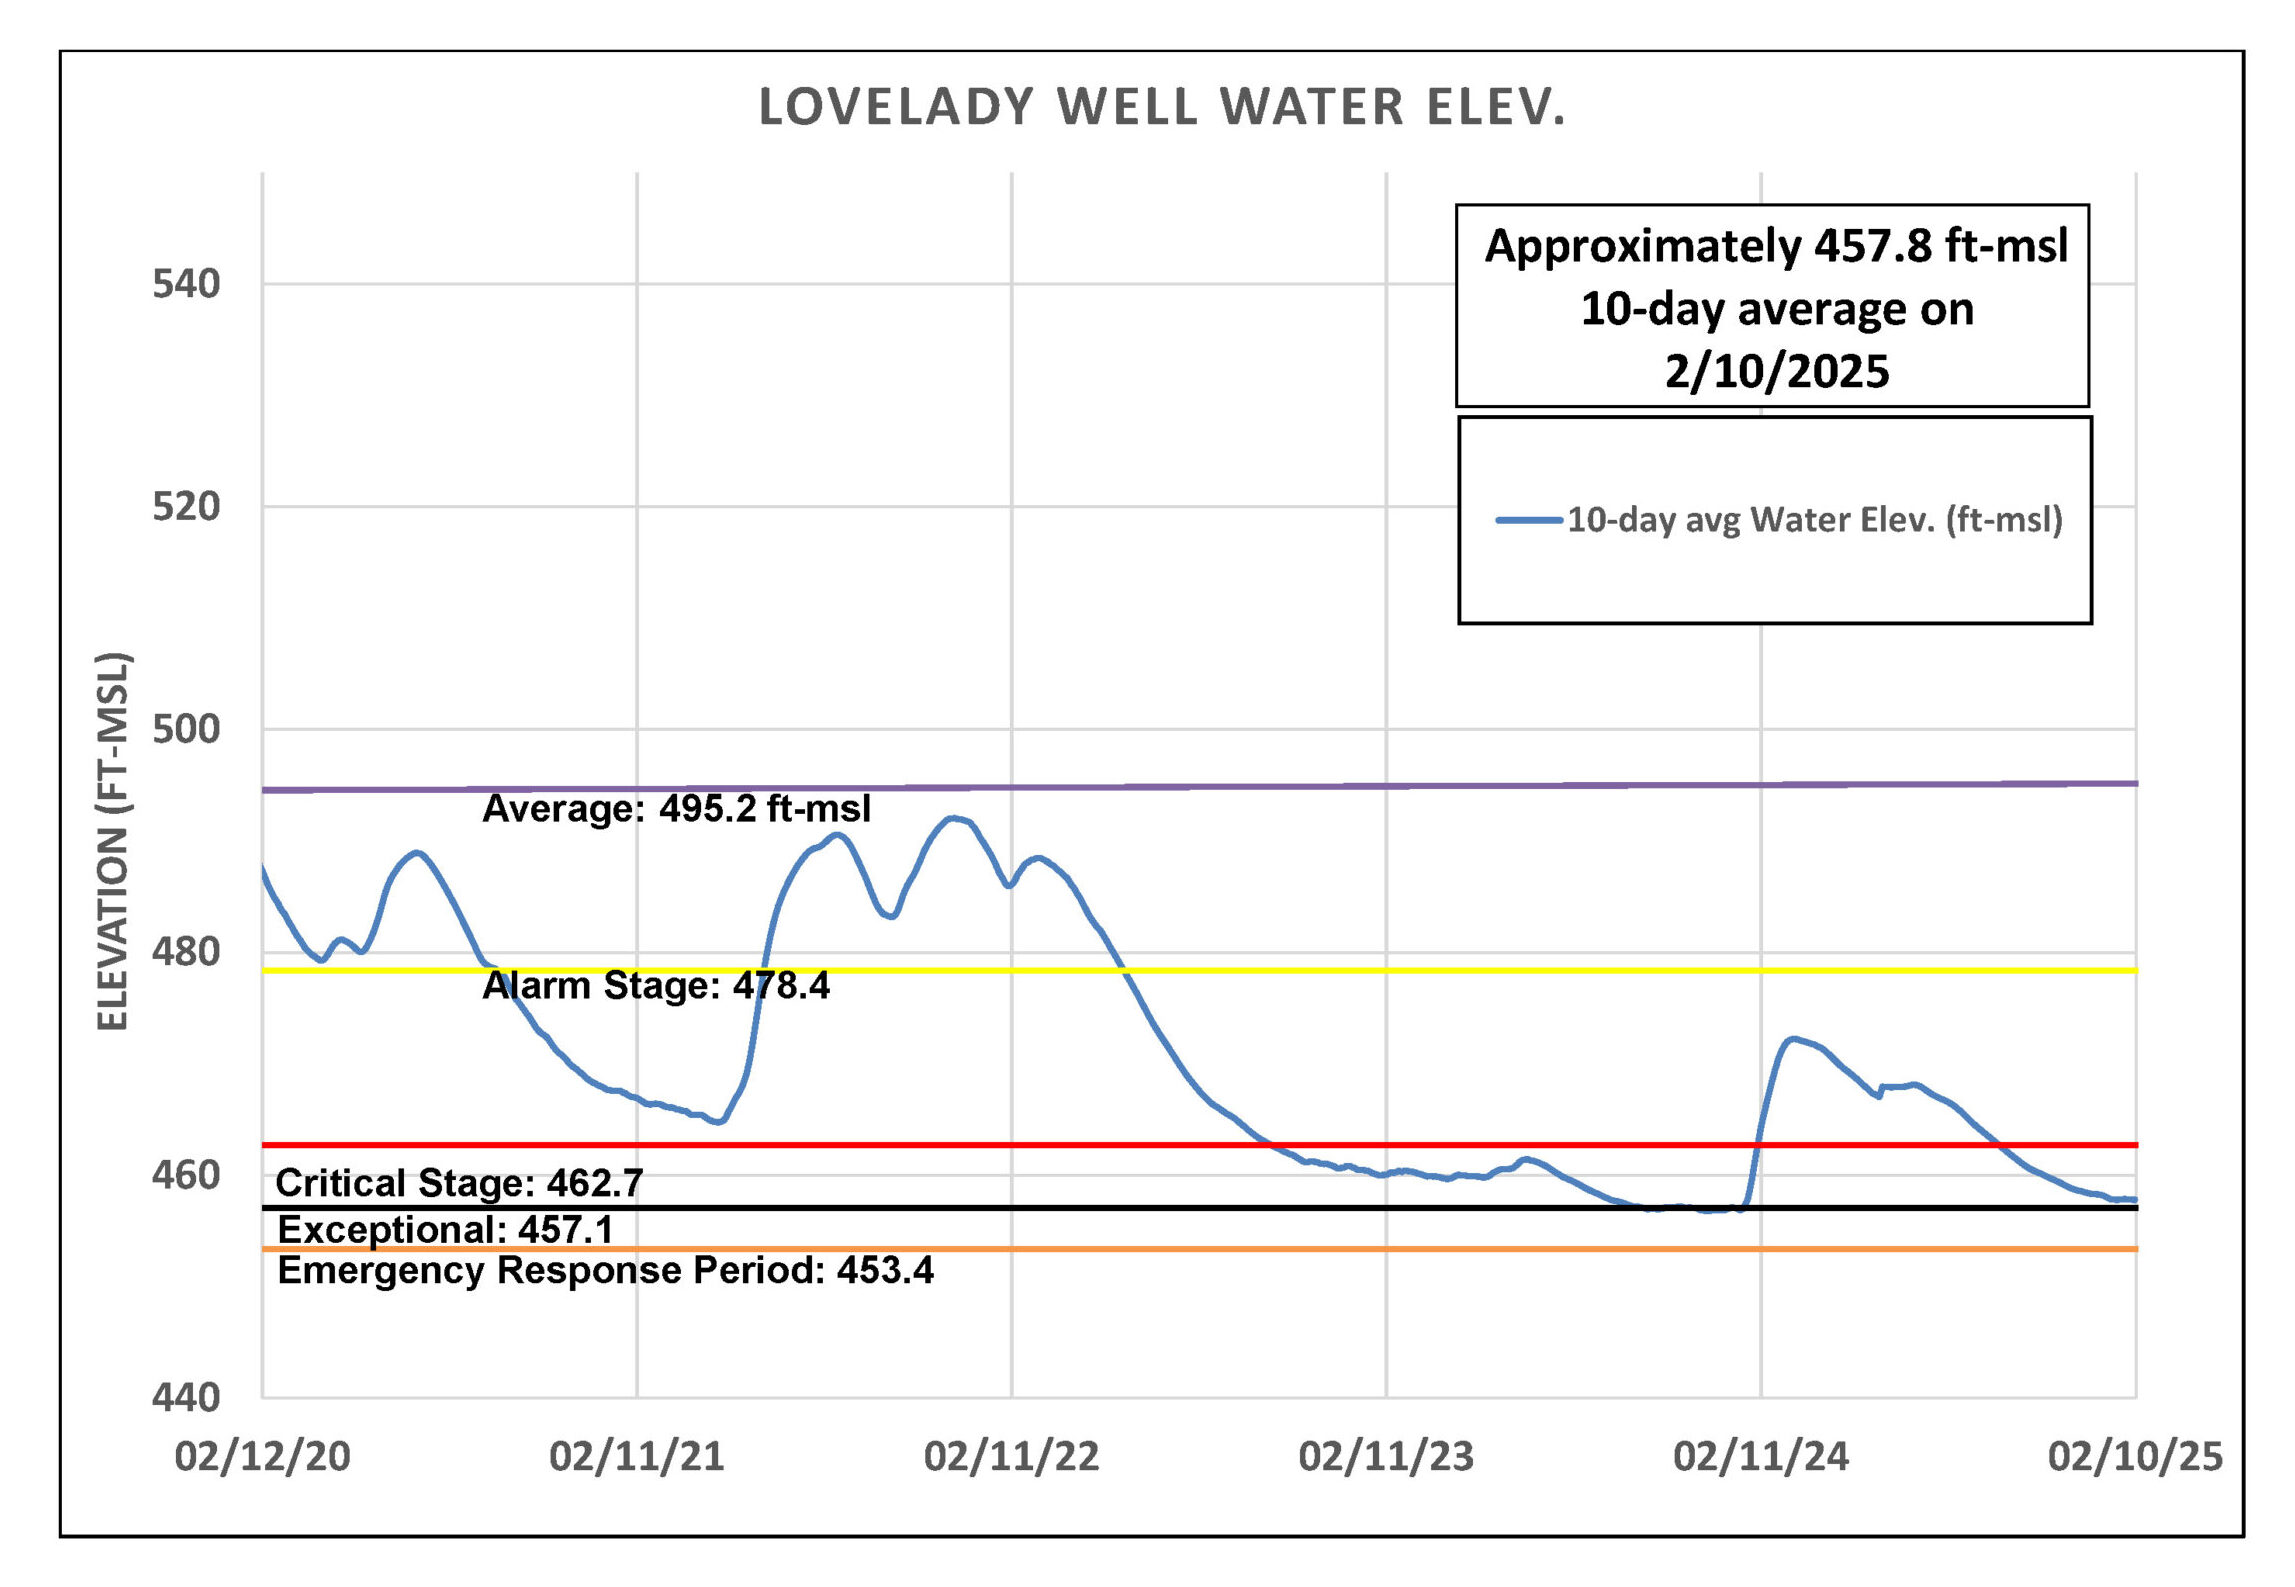
Figure 3. Lovelady groundwater level over the last five years.
Trinity Aquifer
The water level in the Lowe-Coronado Middle Trinity monitor well, located in the Rolling Oaks neighborhood in Driftwood, had remained stable and flat-lined from mid-November 2024 until early February, when they resumed a steady decline (Figure 4).
Jacob’s Well Spring (JWS) showed a brief increase in flow following the late January rainfall, temporarily reaching nearly 1.0 cfs before declining back to near zero. The Blanco River at Wimberley gauge peaked at 14 cfs, up from 7 cfs after the rainfall, and has since stabilized at 7 – 8 cfs a range that has remained consistent since mid-November.
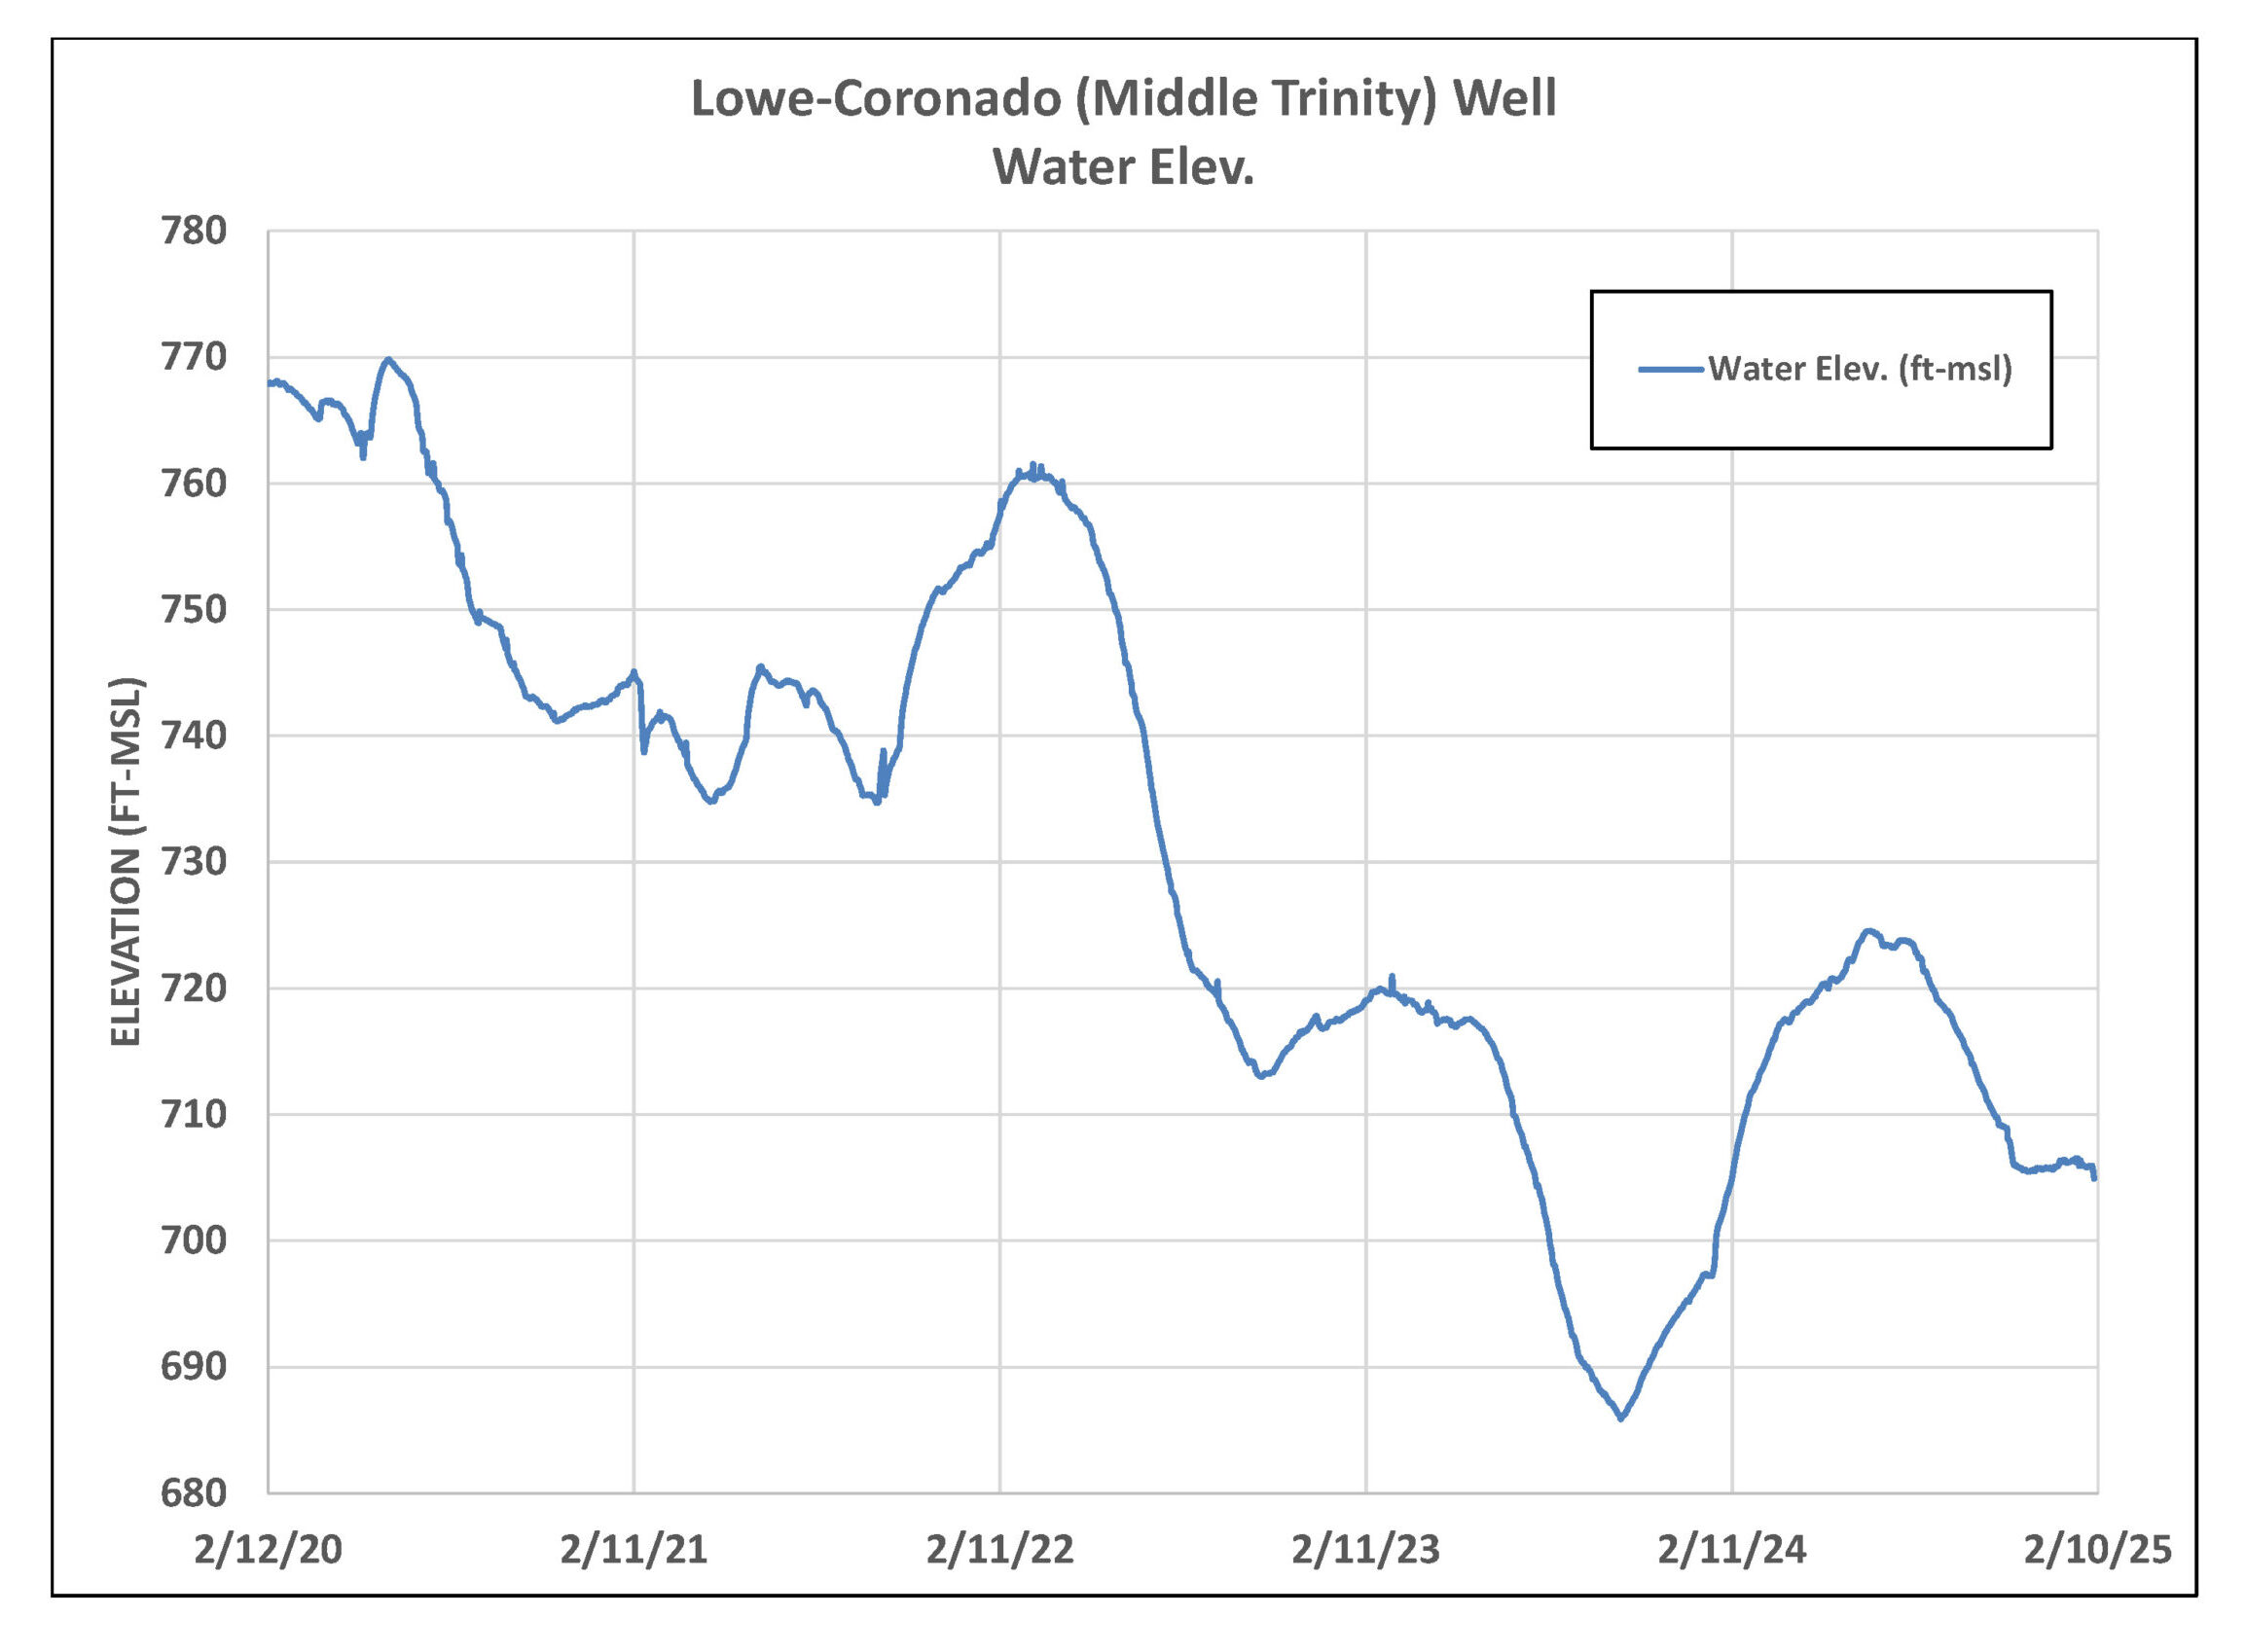
Figure 4. Borheim (Middle Trinity) monitor well water-level elevation.
Water Conservation: Getting Sprinklers Ready for the Growing Season
In the US an average of 8 billion gallons of water is used each day for residential outdoor water use (primarily watering lawns). For reference, this is about the same amount of water the City of Abilene’s nearly 130,000 residents use over an entire year.
As we approach the growing season, managing outdoor water use is a significant way households can reduce water bills and utilization. While not watering lawns at all is the best way to maximize savings, another solution is for homeowners to reduce their outdoor water waste while keeping their landscape healthy. But how can this be accomplished?
The EPA’s WaterSense program makes it easy. WaterSense-labeled products and services are “certified to use at least 20% less water and perform as well as or better than regular models”. Most homes sprinkler systems use a clock-based controller. These are usually set for peak growing season and can result in up to 50% water loss. As an alternative, WaterSense has a label for two types of irrigation controllers:
- Weather-based irrigation controllers
These controllers use local conditions and weather information to adjust the sprinklers’ amount, frequency, and timing of watering. Instead of watering a set amount at a scheduled time each day, irrigation will be based on landscape conditions. - Soil moisture-based irrigation controllers
These controllers detect the amount of moisture in the ground and ensure the yard is only watered when plants need it. This helps prevent your yard from being watered during or shortly after rain events.
Either of these irrigation controllers can be stand-alone devices or be an add on to use with an existing clock-based controller.
