Last month was mild compared to recent Augusts, but it may be surprising to hear that temperatures still averaged 0.5 degrees above normal. Rainfall across the area was below average, and the lack of precipitation is taking a toll on the aquifers. Lovelady monitor well groundwater levels and Barton Springs flow rose briefly after early July rains but are once again declining due to the ongoing deficit. As a result, the District remains in Stage 2 Critical Drought (formerly Stage III Critical Drought).
Rainfall
In August, Camp Mabry recorded 1.2 inches of rain, while Austin–Bergstrom International Airport (ABIA) measured 1.3 inches. That averages out to just 1.2 inches across the area—far below the historical August norm of 2.9 inches (Figure 1). This 1.7-inch deficit is especially significant since August is typically Central Texas’ fifth-wettest month, often bolstered by tropical systems during hurricane season. With no storms forming in the Gulf this year, conditions remained dry and drought has once again intensified.
In 2025 as a whole, Central Texas is currently only about 2 inches below the year-to-date average. However, the region still faces a deep cumulative deficit of roughly 21 inches over the past three years. This long-term shortfall has exacerbated drought conditions. Without significant rainfall, the area could descend into Stage 3 Exceptional Drought (previously known as Stage IV Exceptional Drought) this month as groundwater levels continue to decline.
Looking ahead, September is typically the most active month for tropical storms and hurricanes in the Gulf. It also ranks as Texas’ fourth-wettest month, with an average of 3.2 inches of rain. Current forecasts call for near-normal rainfall this month, which could help the District avoid entering Stage 3 Exceptional Drought.
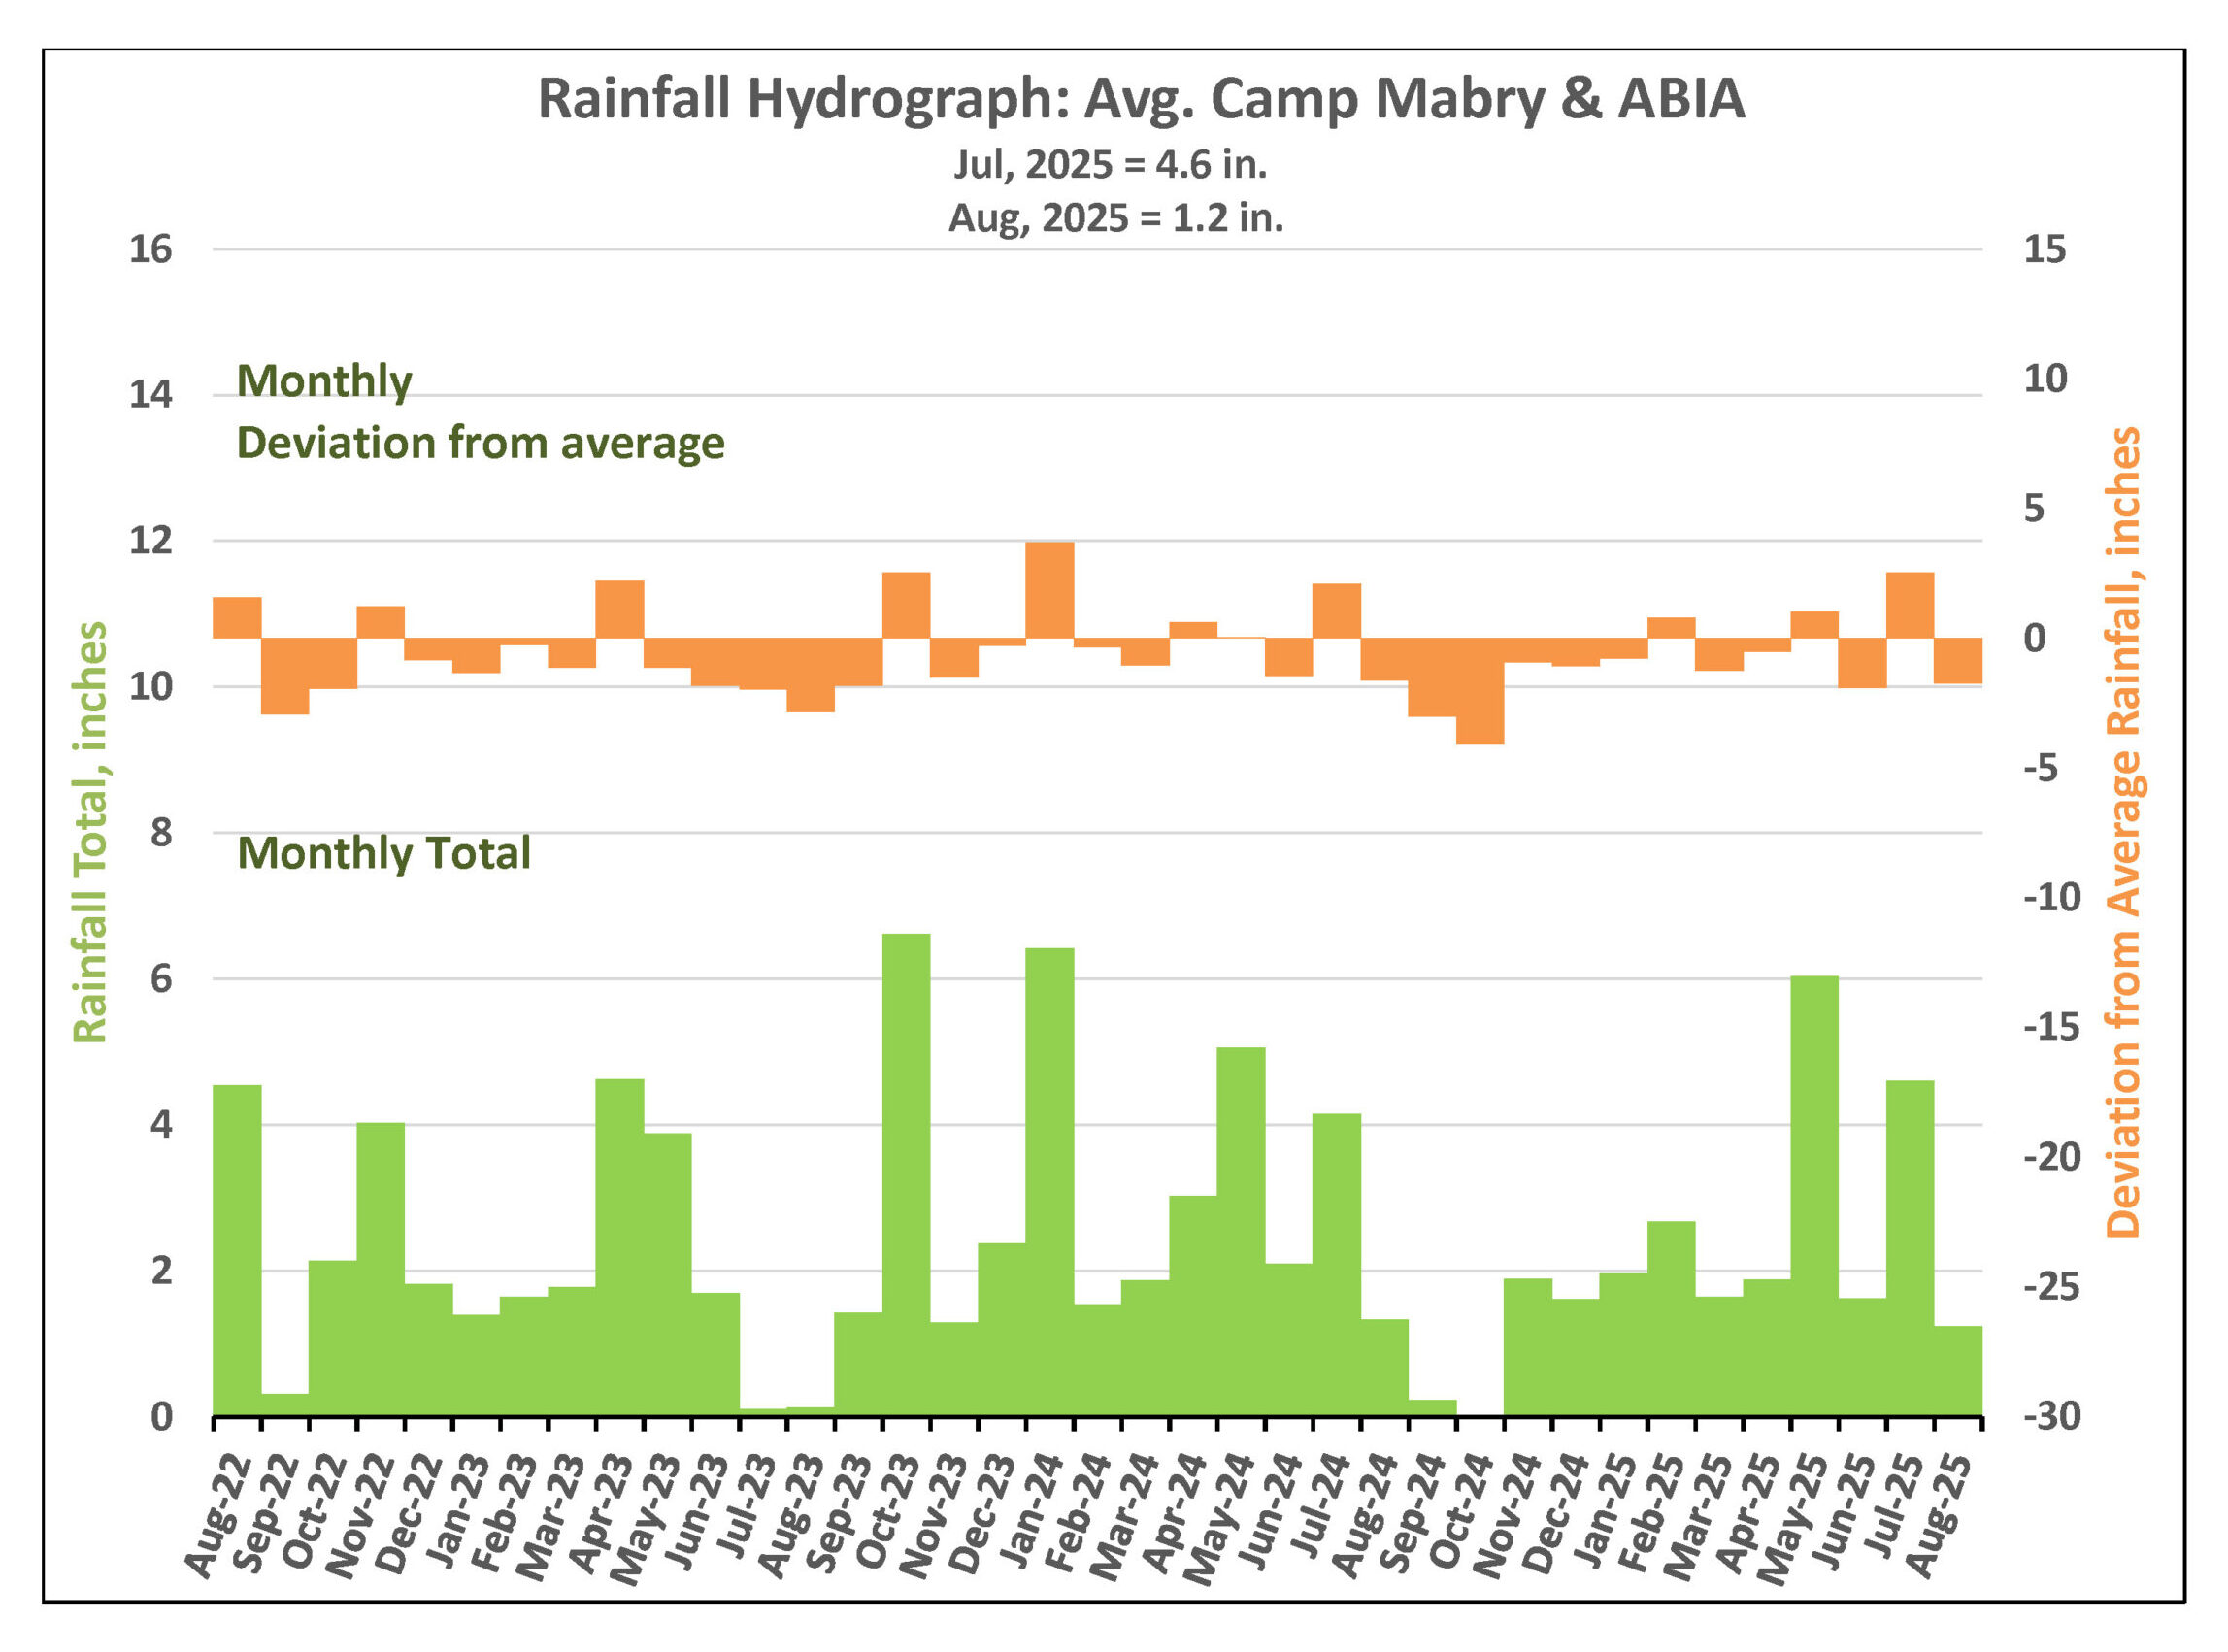
Figure 1. Monthly deviation from average and monthly total rainfall in District’s territory.
Drought Triggers and Status
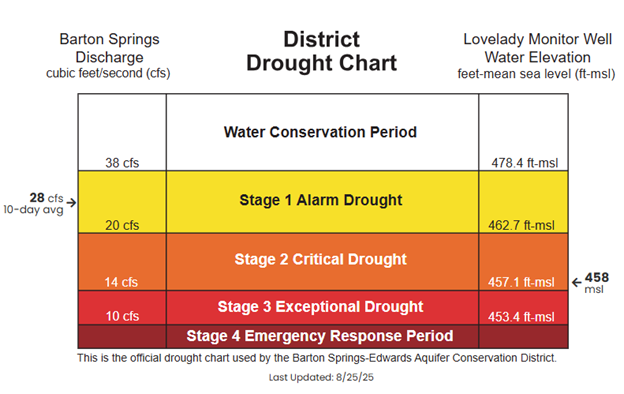
District Drought Chart as of August 25, 2025 displaying 10-day averages for springflow at Barton Springs (left) and groundwater levels at Lovelady monitor well (right)—both of which play a role in determining the District’s drought stage.
Barton Springs Flow
August rainfall fell short of what was needed to sustain the springflow boost we saw from the early July storms. As a result, those gains were short-lived, and since mid-July springflow has returned to a steady downward trend (Figure 2). Note: The most recent data may look blockier than earlier, smoother records. This is because it’s based on 10-day averages from two manual measurements, rather than continuous USGS gauge data. While real-time gauge data during very low flows can be affected by pool operations (such as holding back water to maintain pool levels), manual measurements help avoid that uncertainty.
As of September 4, the 10-day average flow at Barton Springs is about 22 cubic feet per second (cfs). This estimate comes from the two most recent manual measurements: 25.6 cfs on July 24 and 18.7 cfs on August 13. The next manual measurement is scheduled for September 10.
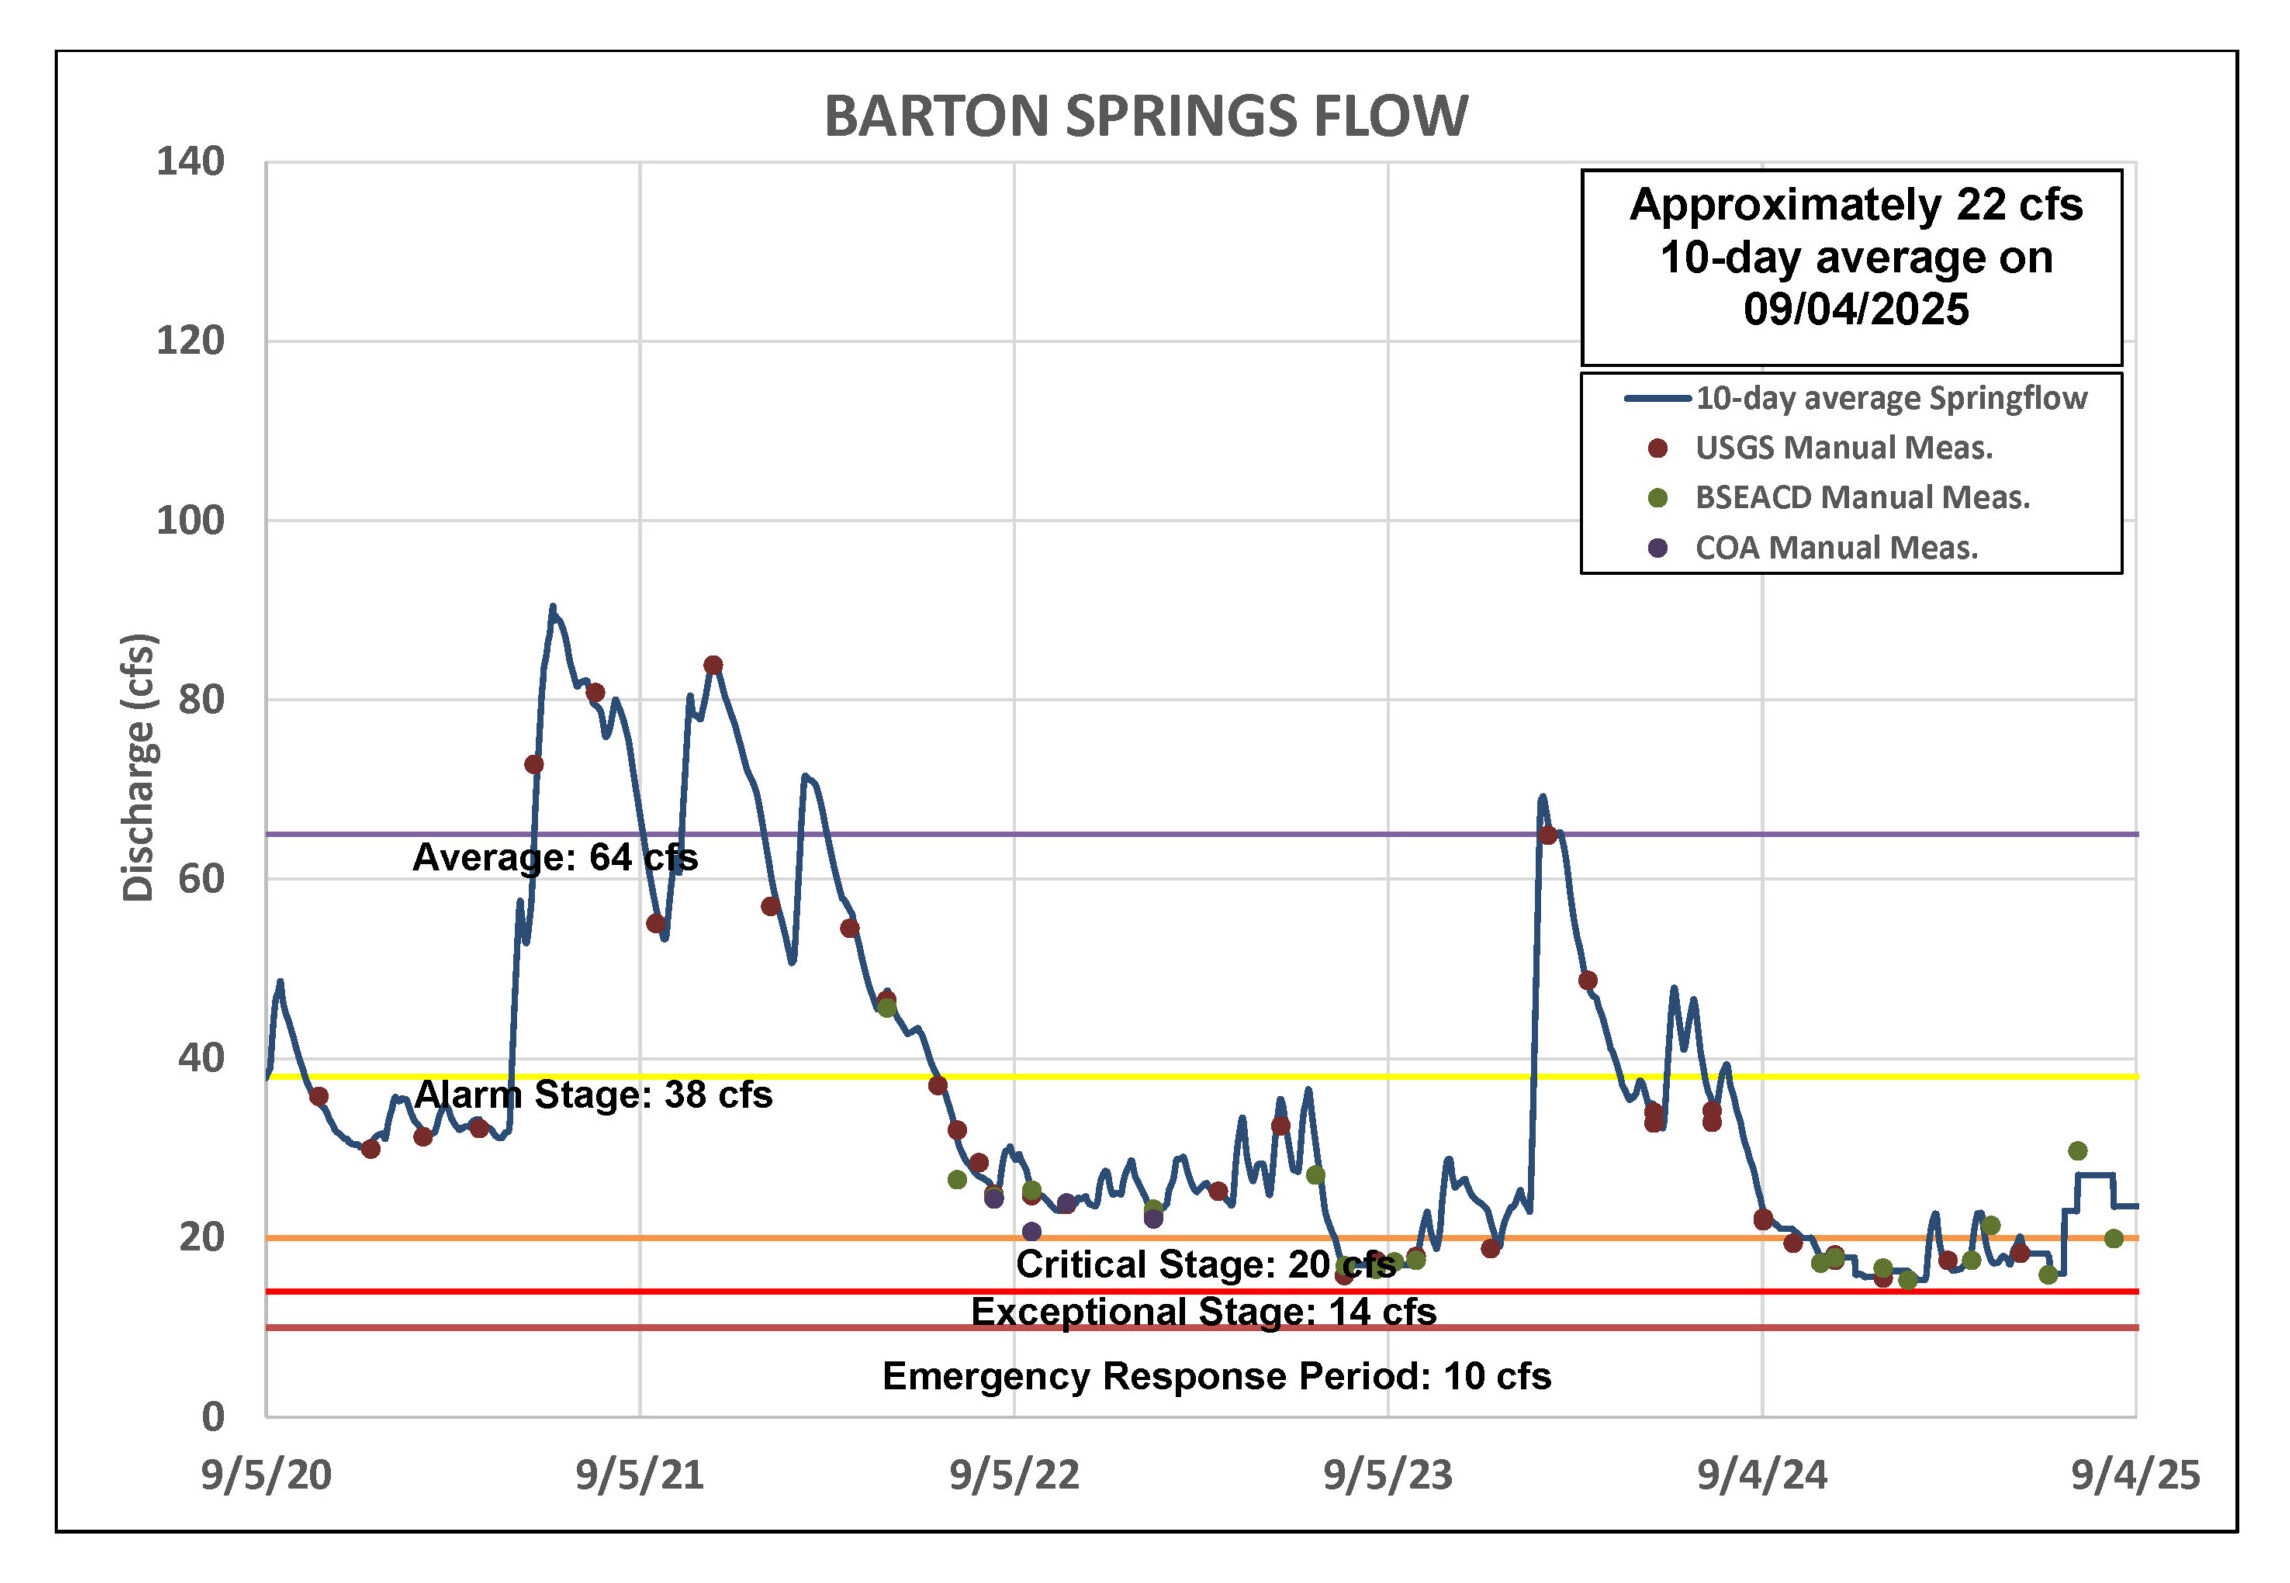
Figure 2. Barton Springs flow for the last five years.
Lovelady Monitor Well
Days before the early July rains, Lovelady groundwater levels had crossed into the Stage 3 Exceptional Drought threshold. The rainfall brought only temporary relief, raising levels by about 0.6 feet. Now, the decline has resumed, and Lovelady is approaching the Exceptional Drought threshold once again (Figure 3).
As of September 4, the 10-day average water level at the Lovelady monitor well was 457.3 feet above mean sea level (ft-msl), keeping the District within Stage 2 Critical Drought for the time being. Without another timely and significant rainfall, Lovelady could trigger a Stage 3 Exceptional Drought declaration this month.
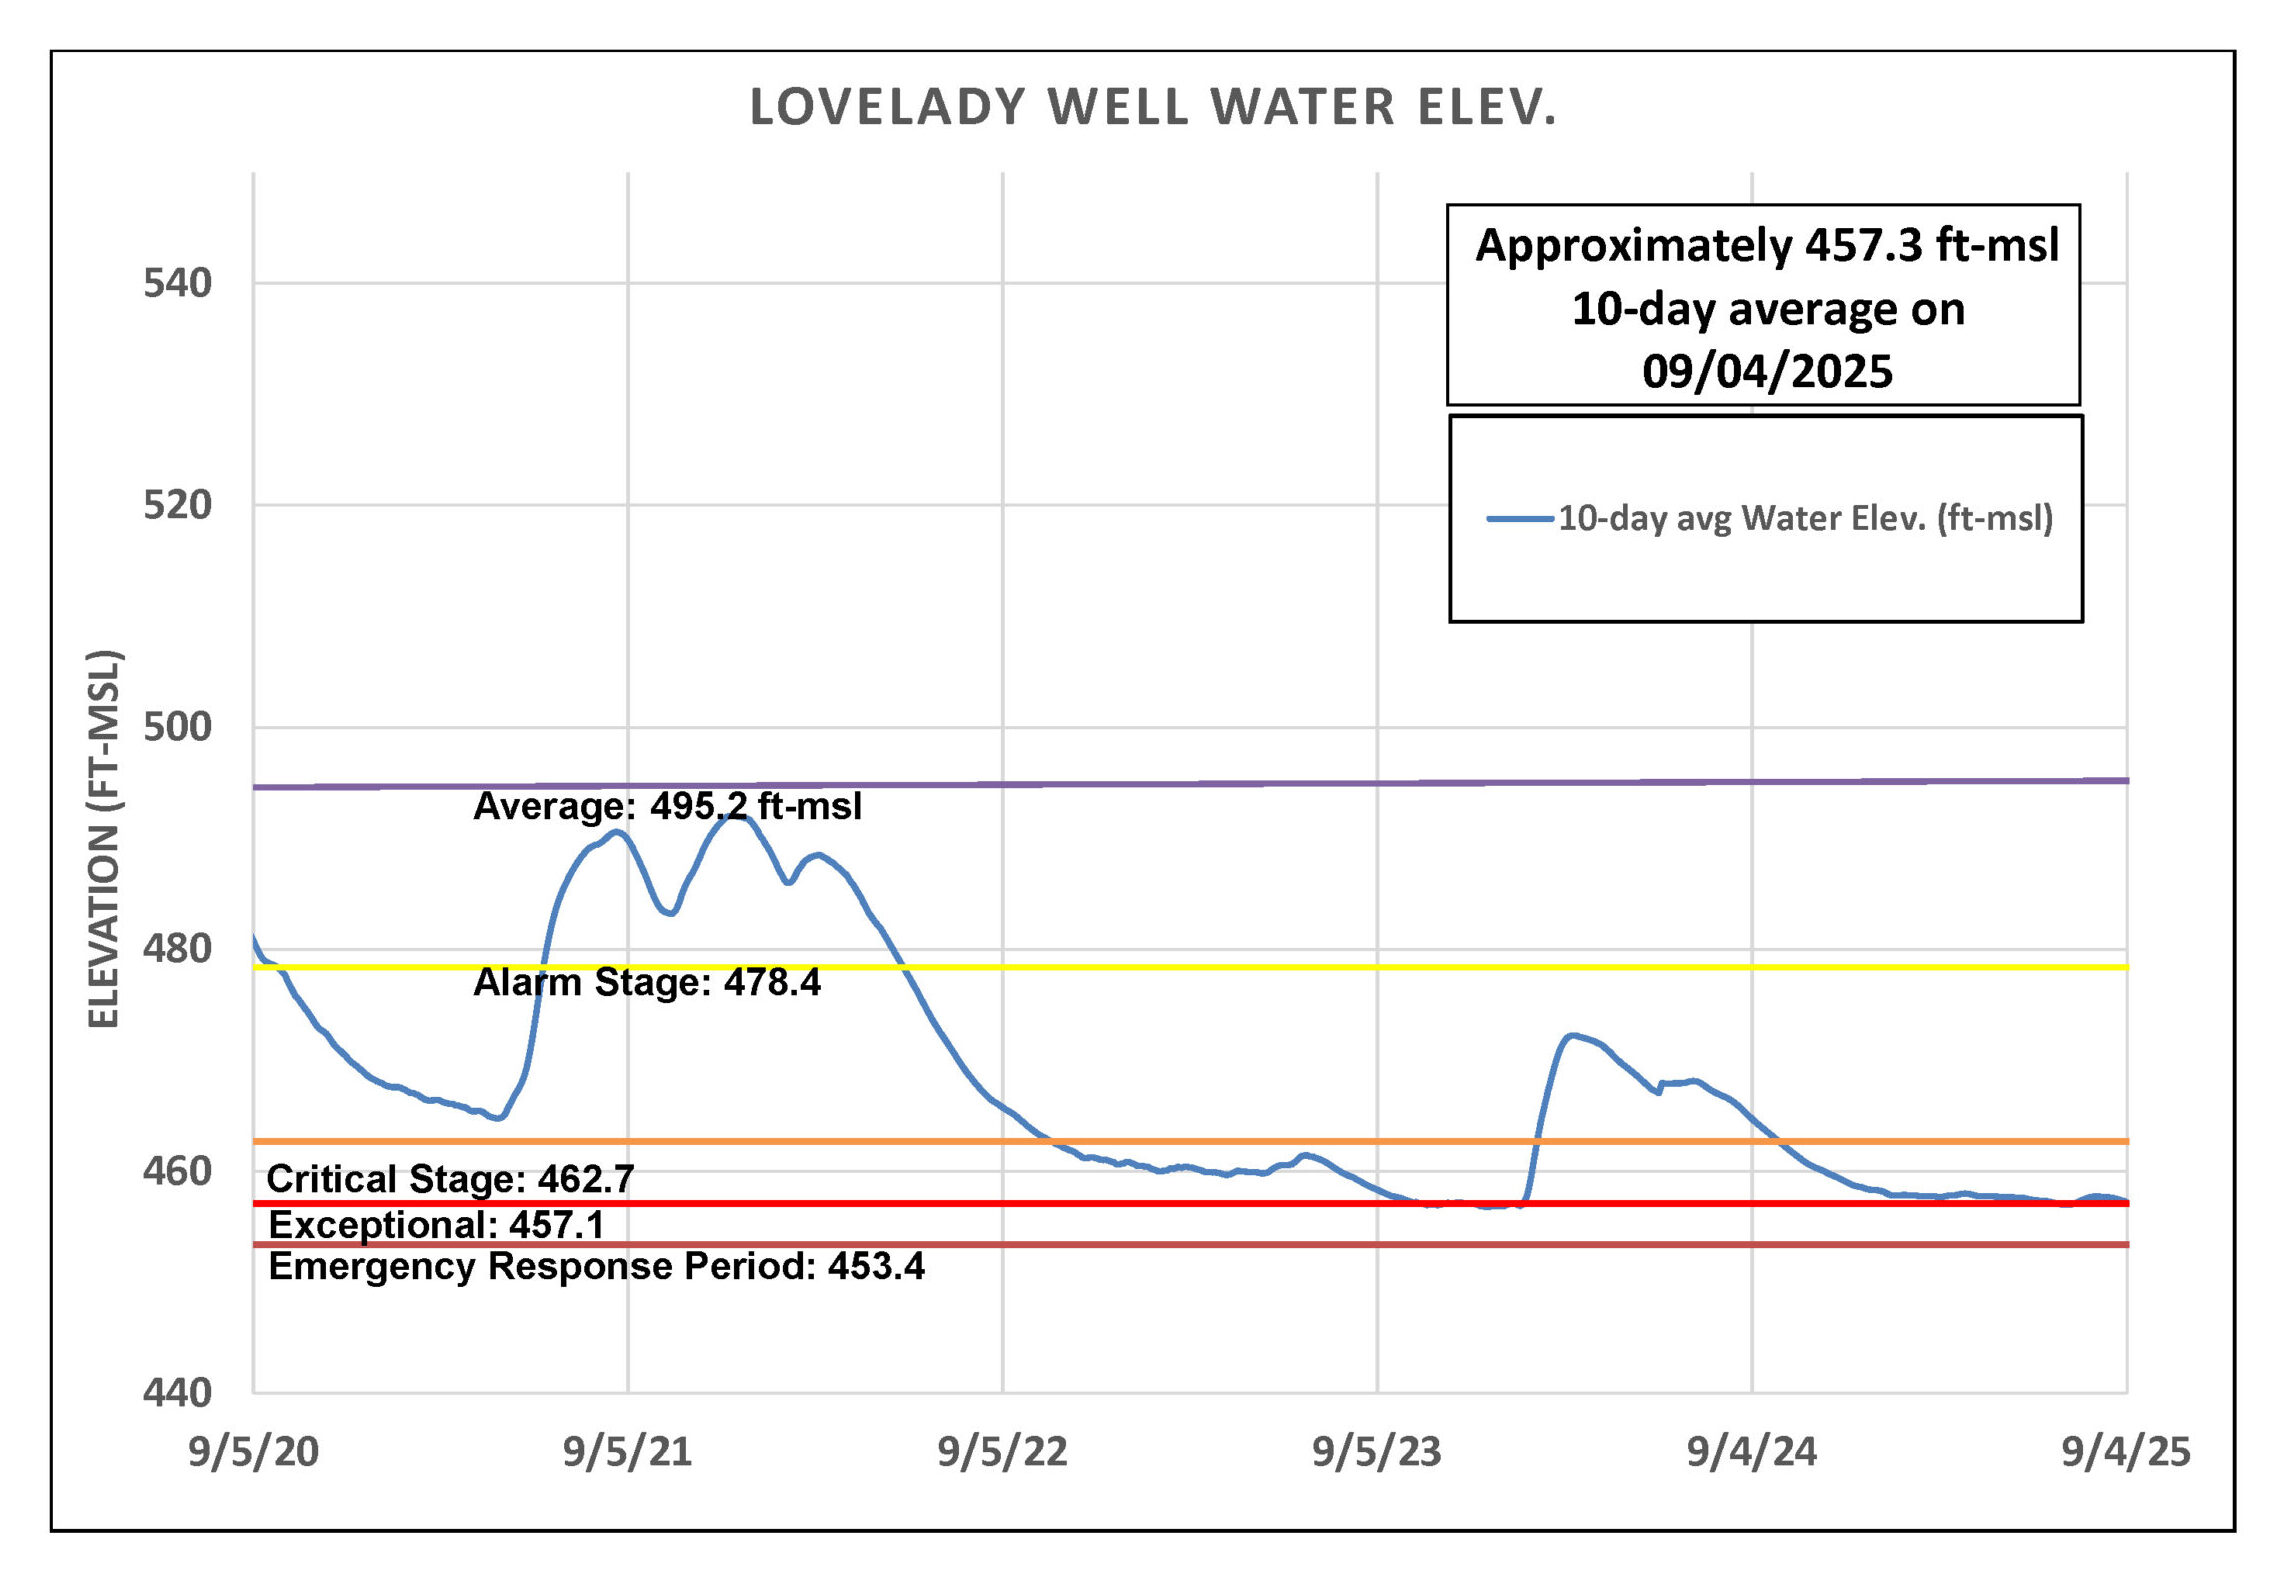
Figure 3. Lovelady groundwater level over the last five years.
Trinity Aquifer
The Lowe-Coronado Middle Trinity monitor well, located in the Rolling Oaks neighborhood of Driftwood, has been in steady decline since March 2025 and showed very little improvement from the above-average rains in July (Figure 4). This downward trend is consistent across all regional aquifers, including the overlying Upper Trinity.
Several shallow Upper Trinity wells in Central and Western Hays County are especially struggling in this prolonged drought, with water levels now comparable to those recorded in 2023. That was the last time the District declared Stage 3 Exceptional Drought, which was a first in the District’s history.
As of September 4, the 10-day average flow at Jacob’s Well Spring (JWS) is just 0.1 cubic feet per second (cfs). In contrast, the Blanco River at Wimberley briefly spiked to flows of 25–50 cfs after the valley received about 1.4 inches of rain in late August. However, those peaks were short-lived, and river flows have since dropped back down to 8–12 cfs, placing them within the lowest 25% of historical flow levels.
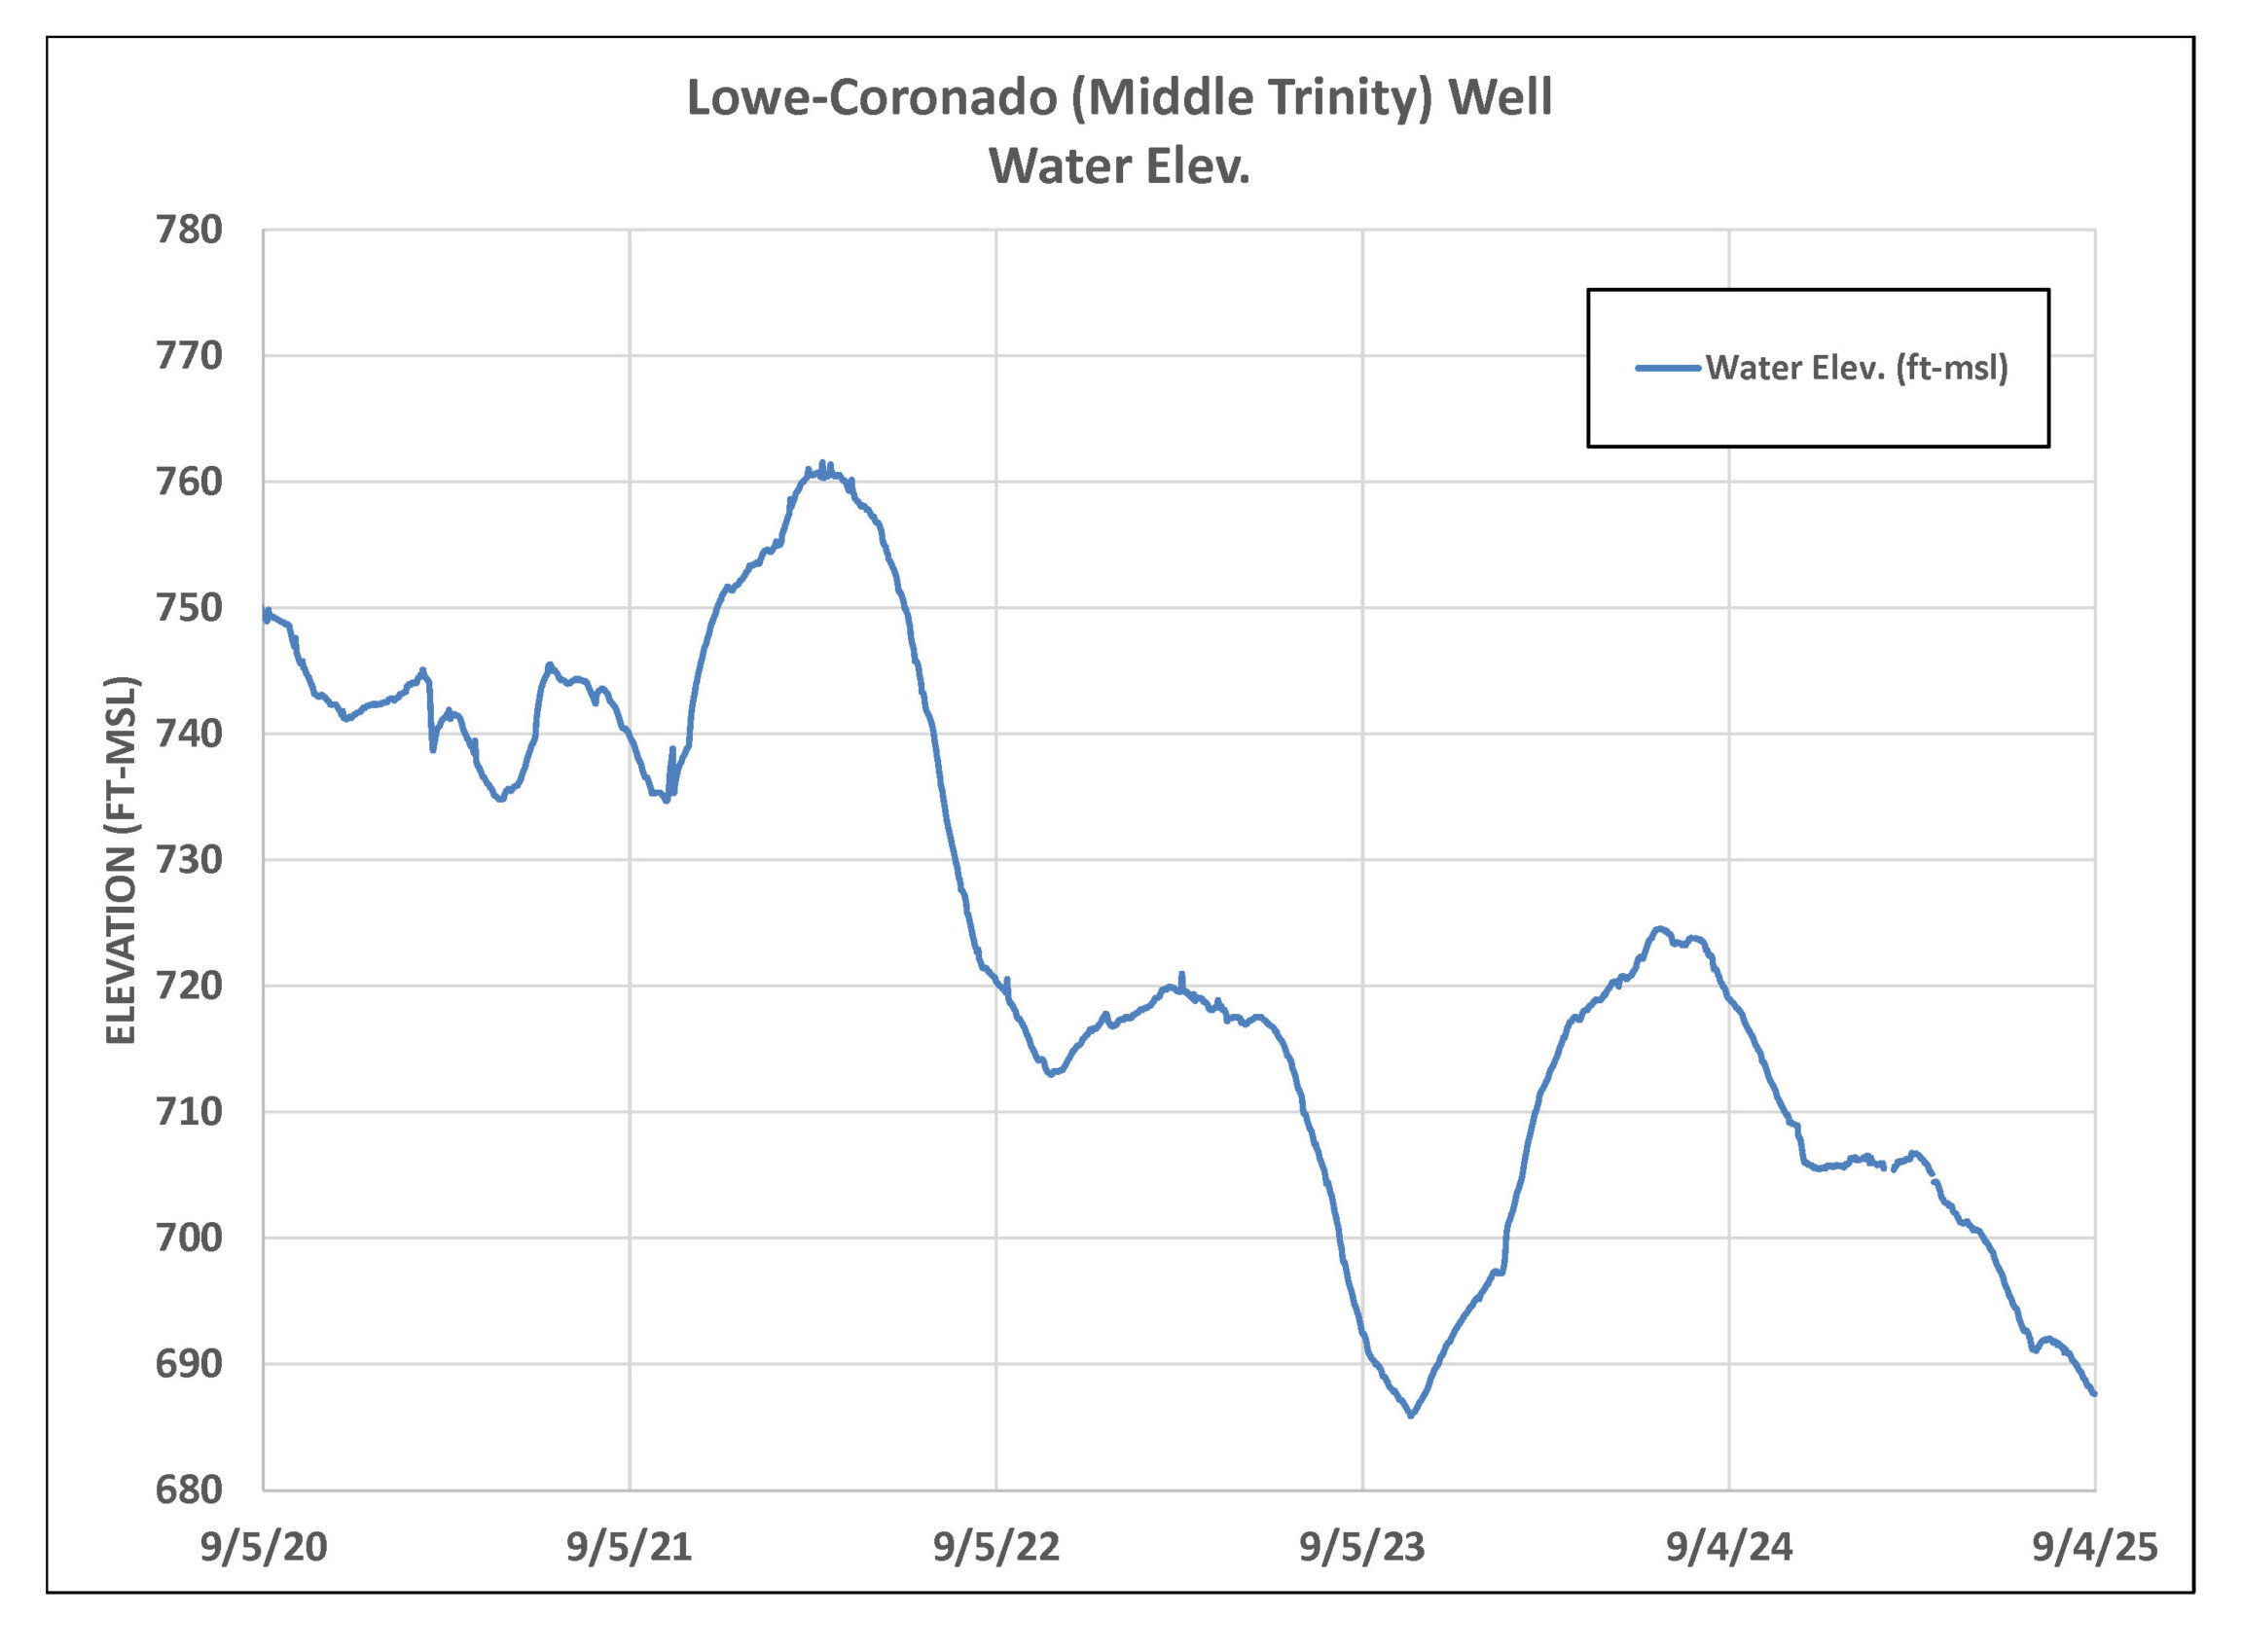
Figure 4. Lowe-Coronado (Middle Trinity) monitor well water-level elevation.
Highland Lakes
Lake levels have on experienced a slight decline since refilling from the early July rainfall. Lake Buchanan is now at 98% capacity—down 1% last month—and Lake Travis is now 88% full, a 2% decrease. Combined, the lakes are currently 92% full.
Residents along the Highland Lakes are encouraged to monitor conditions for potential rainfall and flooding. Areas near the Highland Lakes and the Colorado River can be affected not only by local storms but also by rainfall that occurs upstream in the river’s basin. With lake levels higher than they have been in recent years, it is important to stay aware of upstream weather and rainfall patterns, as that water will eventually flow into the Highland Lakes.