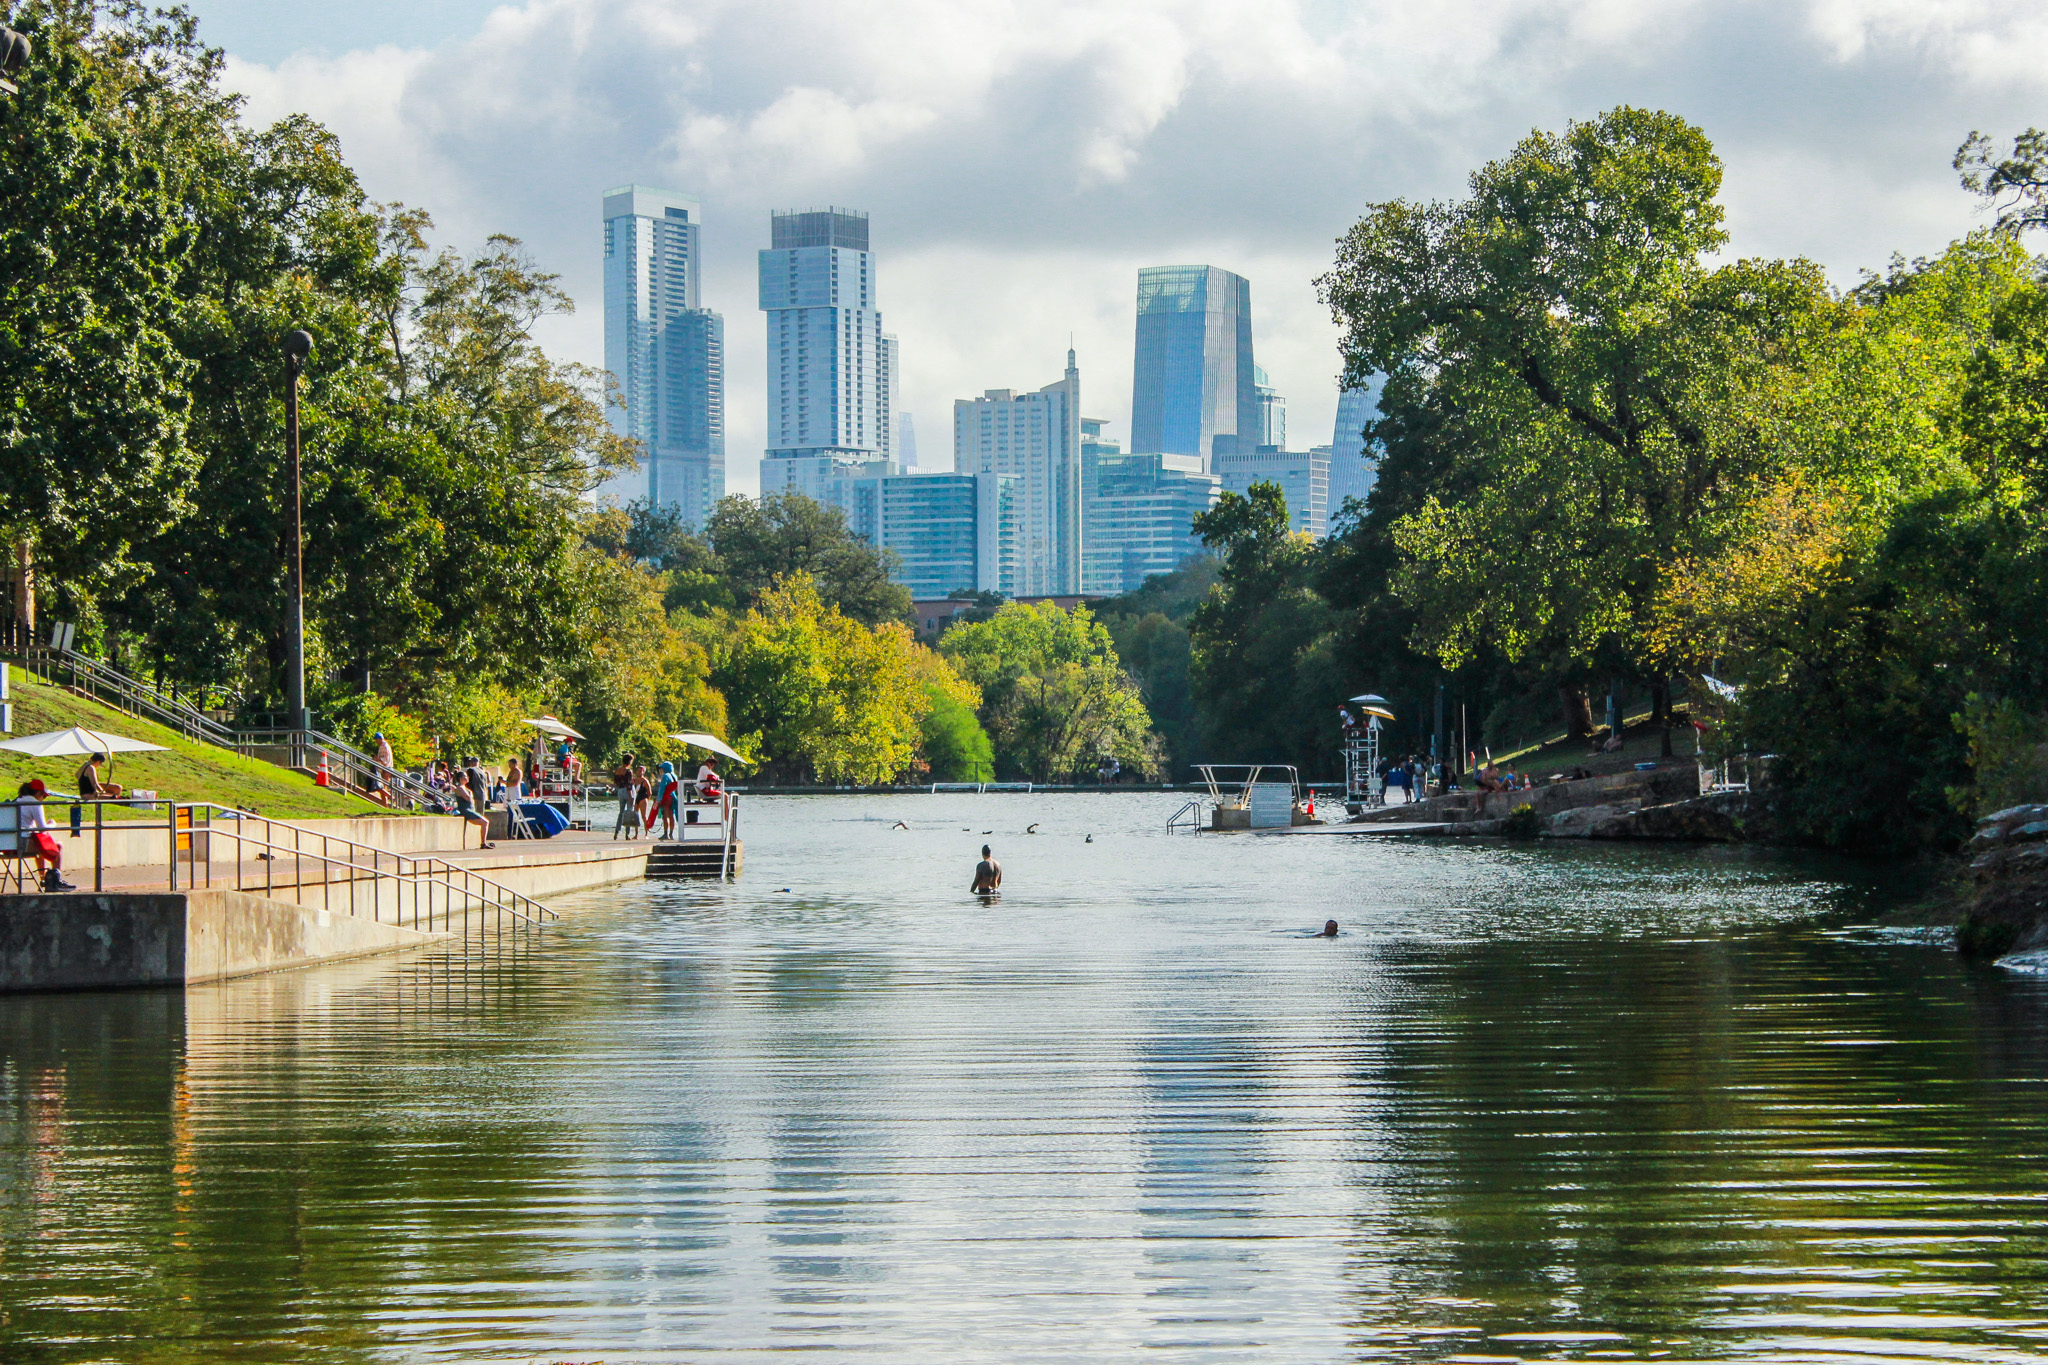
Rainfall
October felt more like summer than fall, tying 1931 as the second warmest October on record with an average temperature of 77°F. Although October is typically Austin’s second-wettest month (after May), it brought only about 2.5 inches of rain between Camp Mabry and ABIA –roughly 1.6 inches below the historical monthly average (Figure 1).
Only a few local creeks – Slaughter, Williamson, and Barton – showed any response to the October 24 – 25 rains over the recharge zone. While this rainfall did provide a small amount of recharge to the aquifer, it was barely noticeable in spring flows and monitor well levels as both continue to decline.
Looking at 2025 as a whole, Central Texas is currently about 6 inches below the year-to-date average. However, the region still faces a deep cumulative deficit of roughly 24 inches over the past three years. This long-term shortfall has exacerbated drought conditions. At the September 11 Board meeting, officials declared Stage 3 Exceptional Drought (previously known as Stage 4 Exceptional Drought), after water levels in the Lovelady monitor well fell below the Stage 3 threshold in early September.
Looking ahead, November is typically Austin’s fifth-wettest month, averaging about 2.9 inches of rain. However, after a drier-than-normal October, the below average rainfall pattern may persist. The Climate Prediction Center’s three-month outlook points to a continued trend of below-average rainfall through the end of 2025. To make matters worse, we’re now entering some of the driest months of the year, December, January, and February, which rank as the fifth, sixth, and first driest on average, respectively.
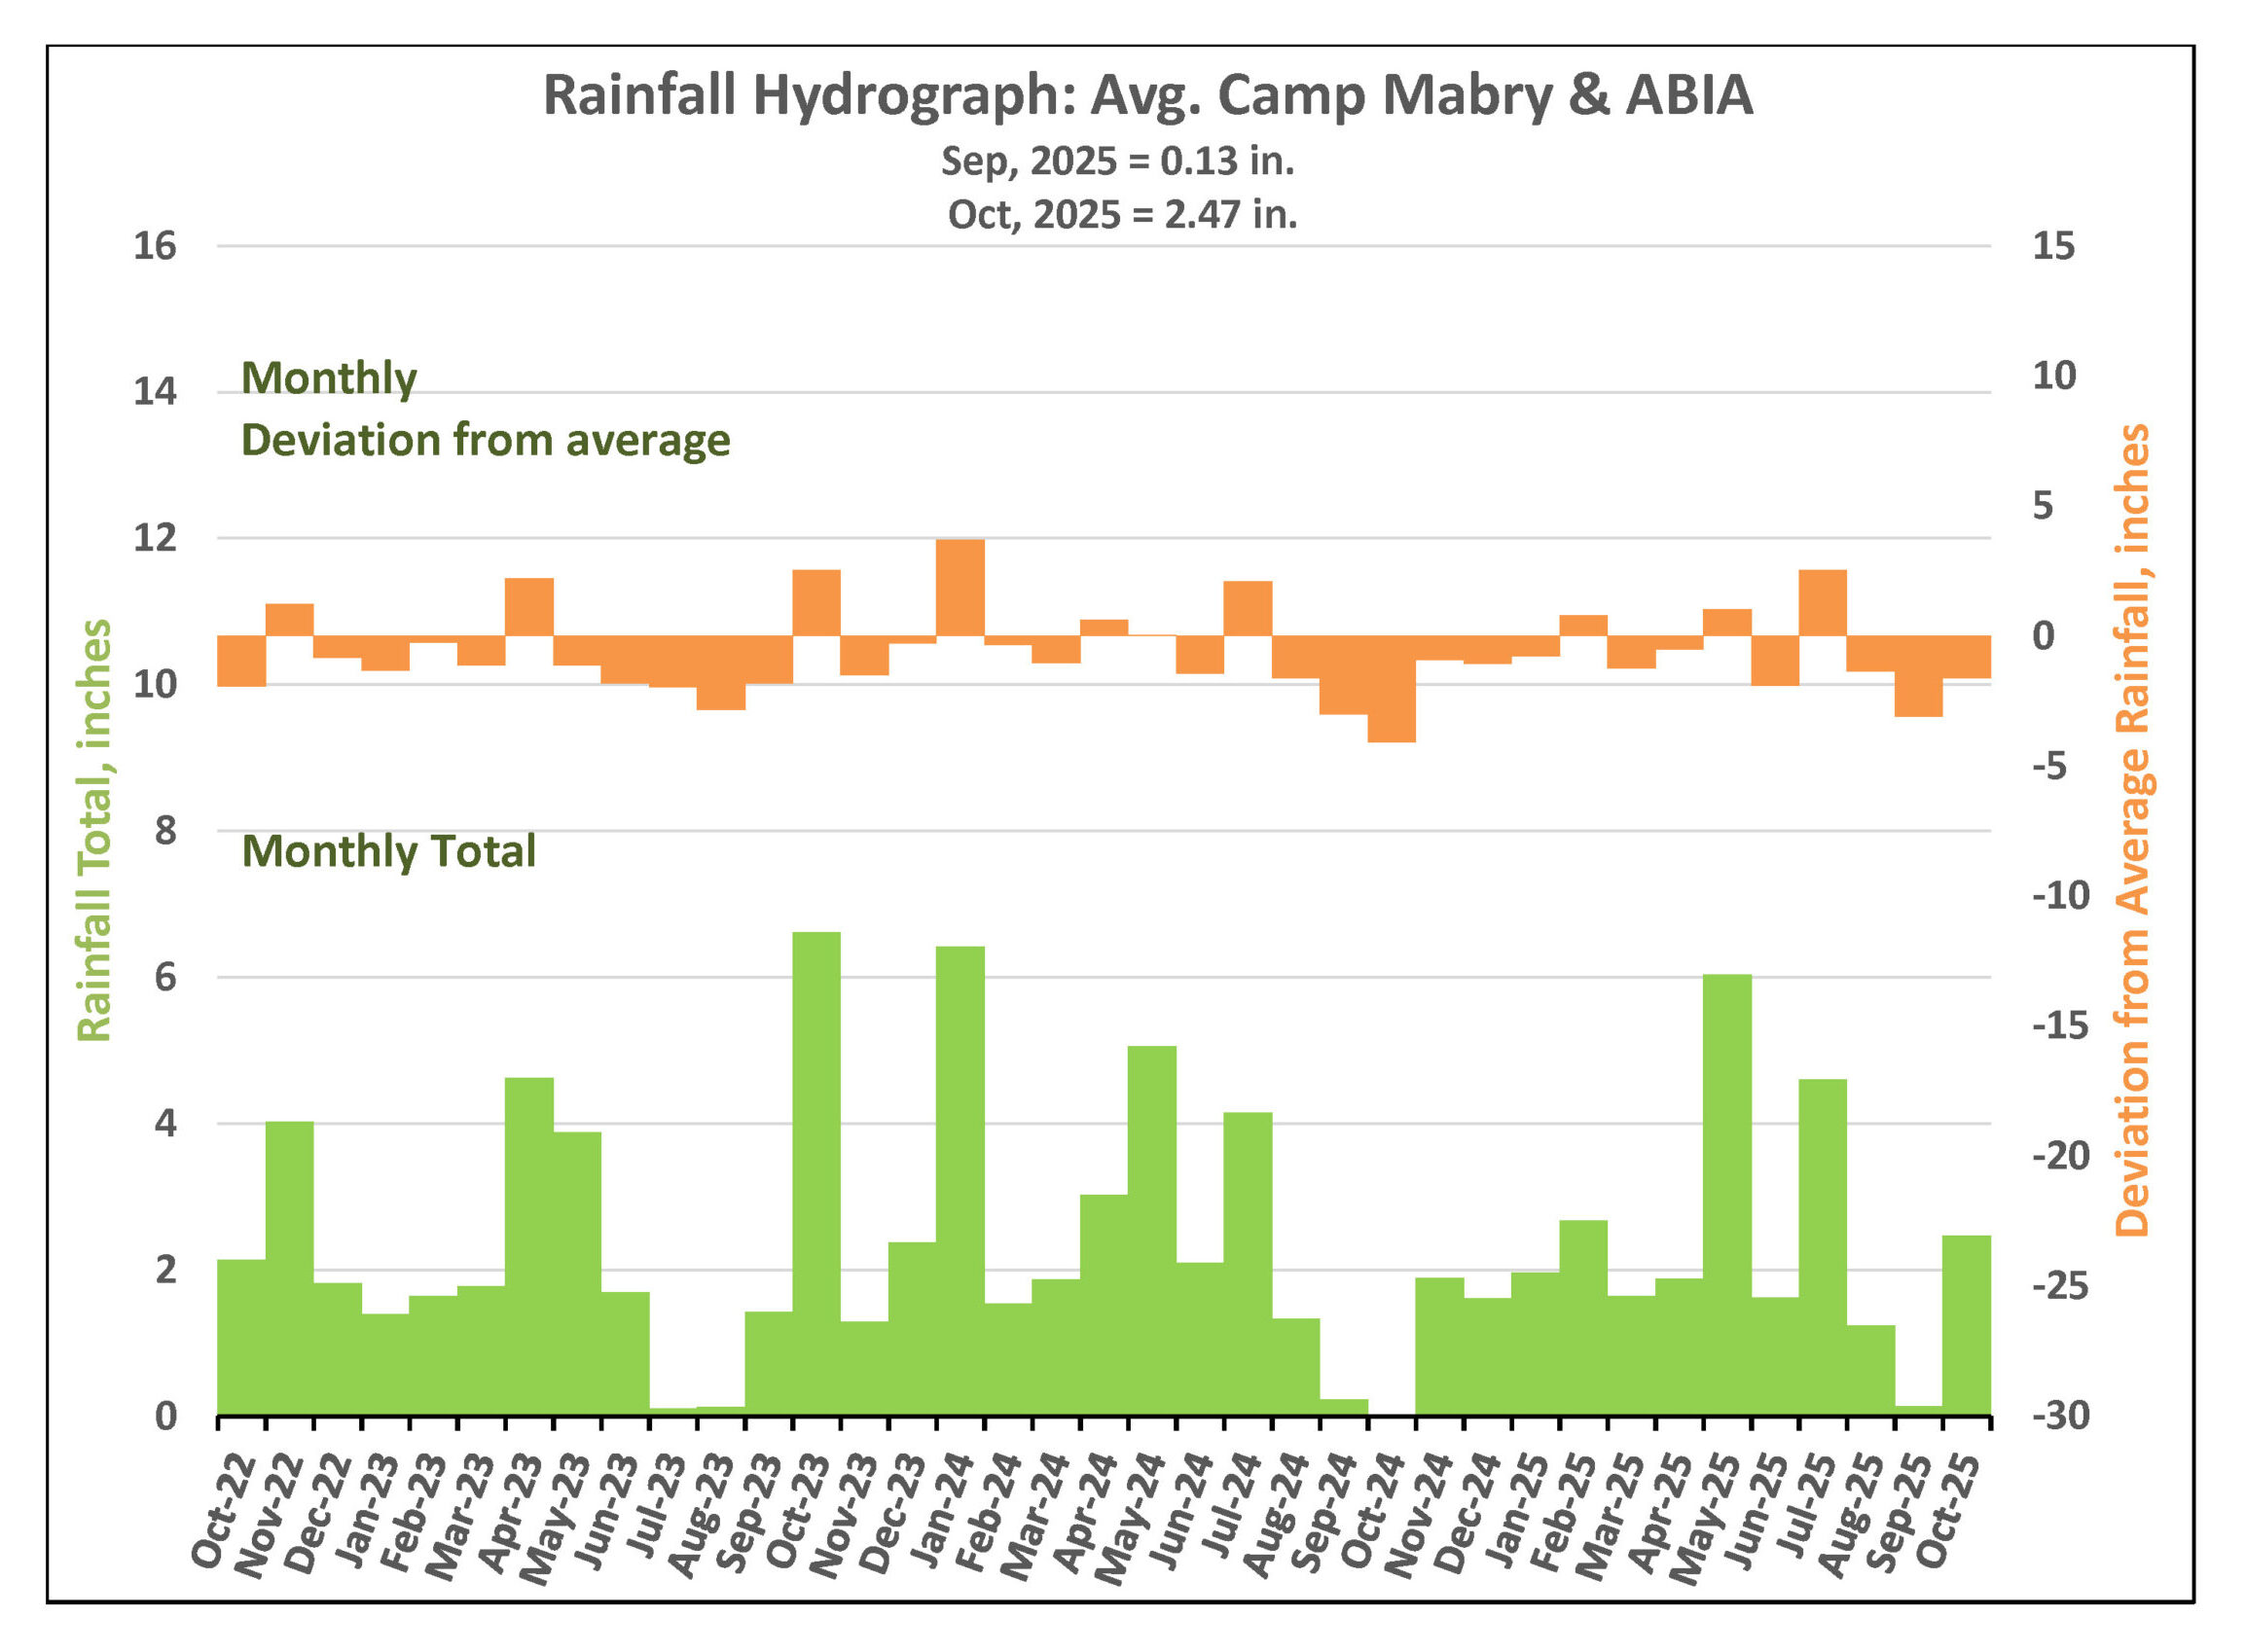
Figure 1. Monthly deviation from average and monthly total rainfall in District’s territory.
Drought Triggers and Status
District Drought Chart as of November 10, 2025 displaying 10-day averages for springflow at Barton Springs (left) and groundwater levels at Lovelady monitor well (right)—both of which play a role in determining the District’s drought stage.
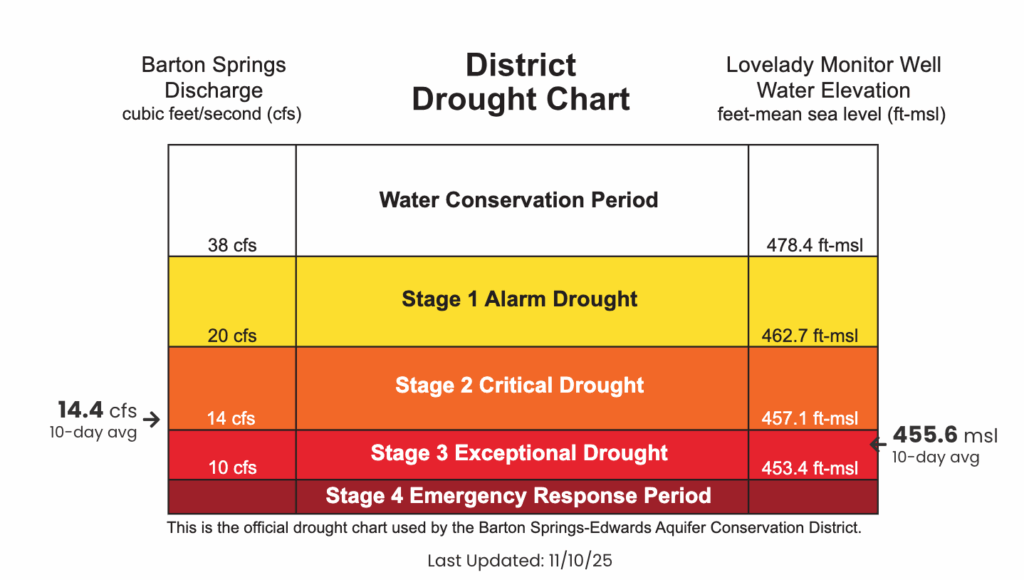
Barton Springs Flow
October followed a very dry August and September, which together brought only 3.8 inches of rain. While every bit of rainfall helps, the limited recharge has not been enough to offset losses, meaning Barton Springs flow continues its steady decline. (Figure 2).
As of November 10, the 10-day average flow at Barton Springs is about 14.4 cubic feet per second (cfs). This estimate comes from the two most recent manual measurements: 14.0 cfs on October 8 and 14.8 cfs on October 31. The next manual measurement is scheduled for mid-November.
Note: The most recent data for Barton Springs may look blockier than earlier, smoother records. This is because it’s based on 10-day averages from two manual measurements, rather than continuous (15-minute) USGS gauge data. Manual measurements provide more reliable results during very low flows, since real-time gauge data can be distorted by pool operations (such as plugging dam outflows to maintain pool levels).
Figure 2. Barton Springs flow for the last five years.
Lovelady Monitor Well
Groundwater levels at the Lovelady monitor well dropped below the Stage 3 Exceptional Drought threshold in early September (Figure 3). For only the second time in the District’s history – the first being on December 14, 2023 – the District’s Board of Directors declared Exceptional Drought.
As of November 11, the 10-day average water level at the Lovelady well is 455.6 feet above mean sea level (ft-msl), which remains within the Stage 3 Exceptional Drought threshold and continues to steadily decline. The current water level is just 2.2 feet above the Stage 4 Emergency Response level.
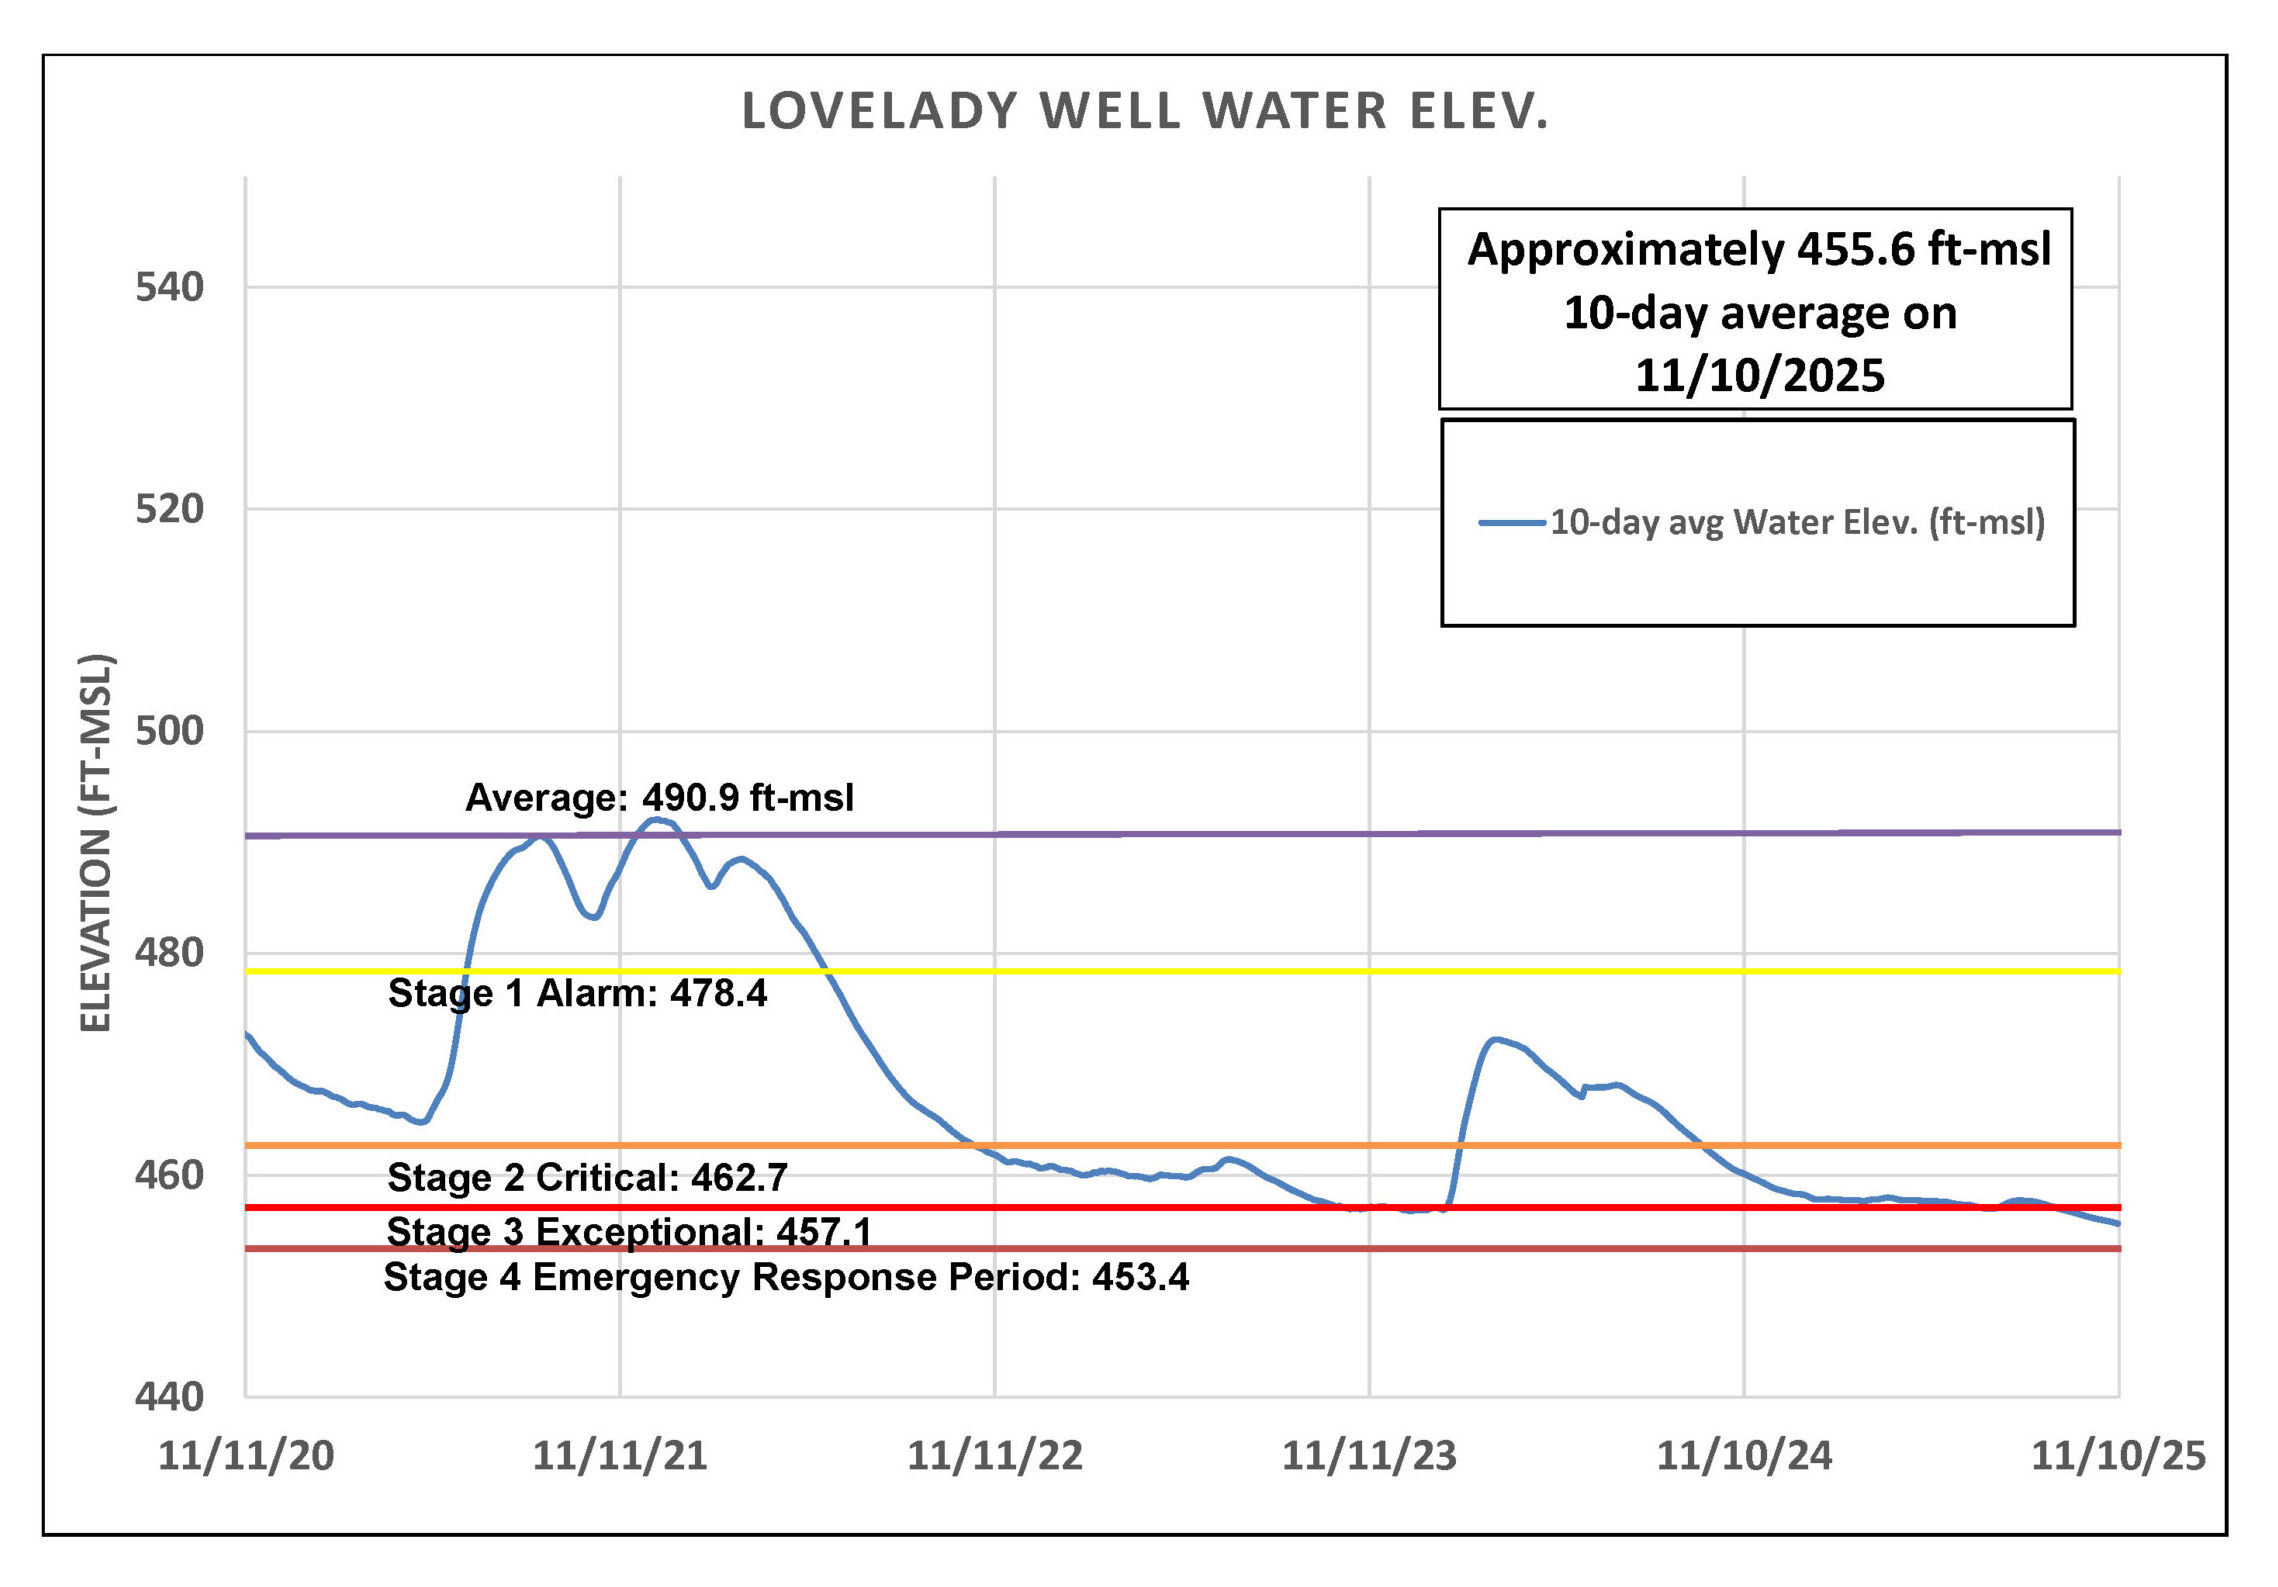
Figure 3. Lovelady groundwater level over the last five years.
Trinity Aquifer
The Lowe-Coronado Middle Trinity monitor well, located in the Rolling Oaks neighborhood of Driftwood, continues to show a steep decline in groundwater levels (Figure 4). Current readings are the lowest recorded since monitoring began in 2015. This downward trend mirrors conditions across the region, including in the overlying Upper Trinity Aquifer.
As of November 11, the 10-day average flow at Jacob’s Well Spring (JWS) is just 0.01 cubic feet per second (cfs). The Blanco River at Wimberley briefly rose to 12-15 cfs following about 1.4 inches of rainfall in late October, but those increases were short-lived. River flows have since fallen back to 5-6 cfs, ranking among the lowest 25% of historical flow levels.
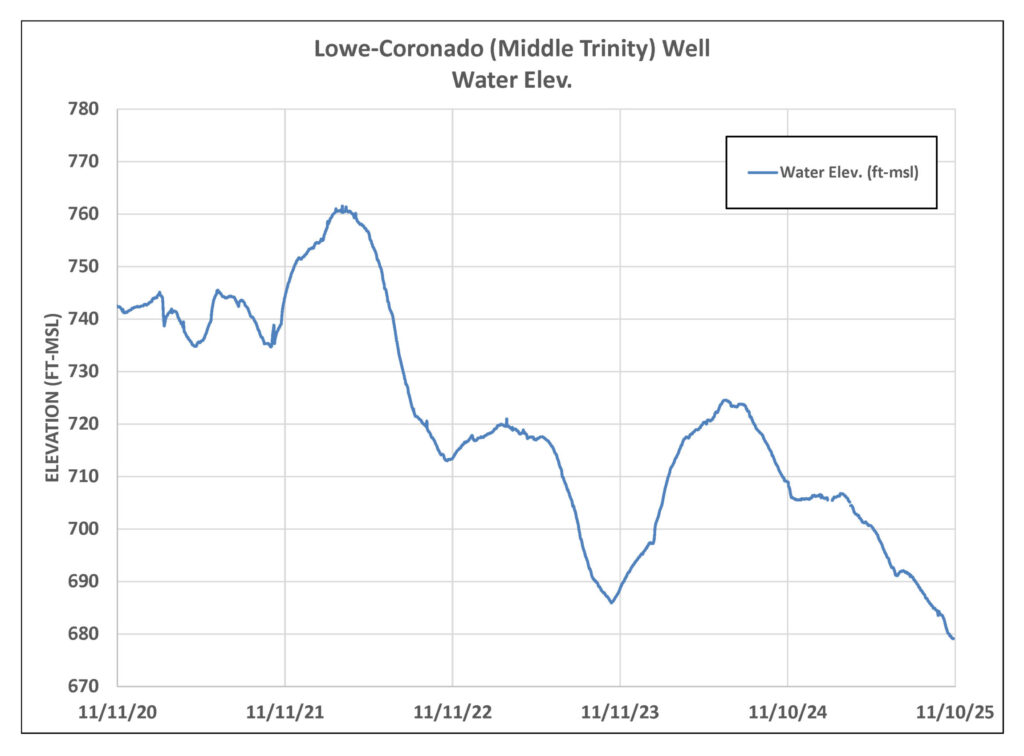
Figure 4. Lowe-Coronado (Middle Trinity) monitor well water-level elevation.