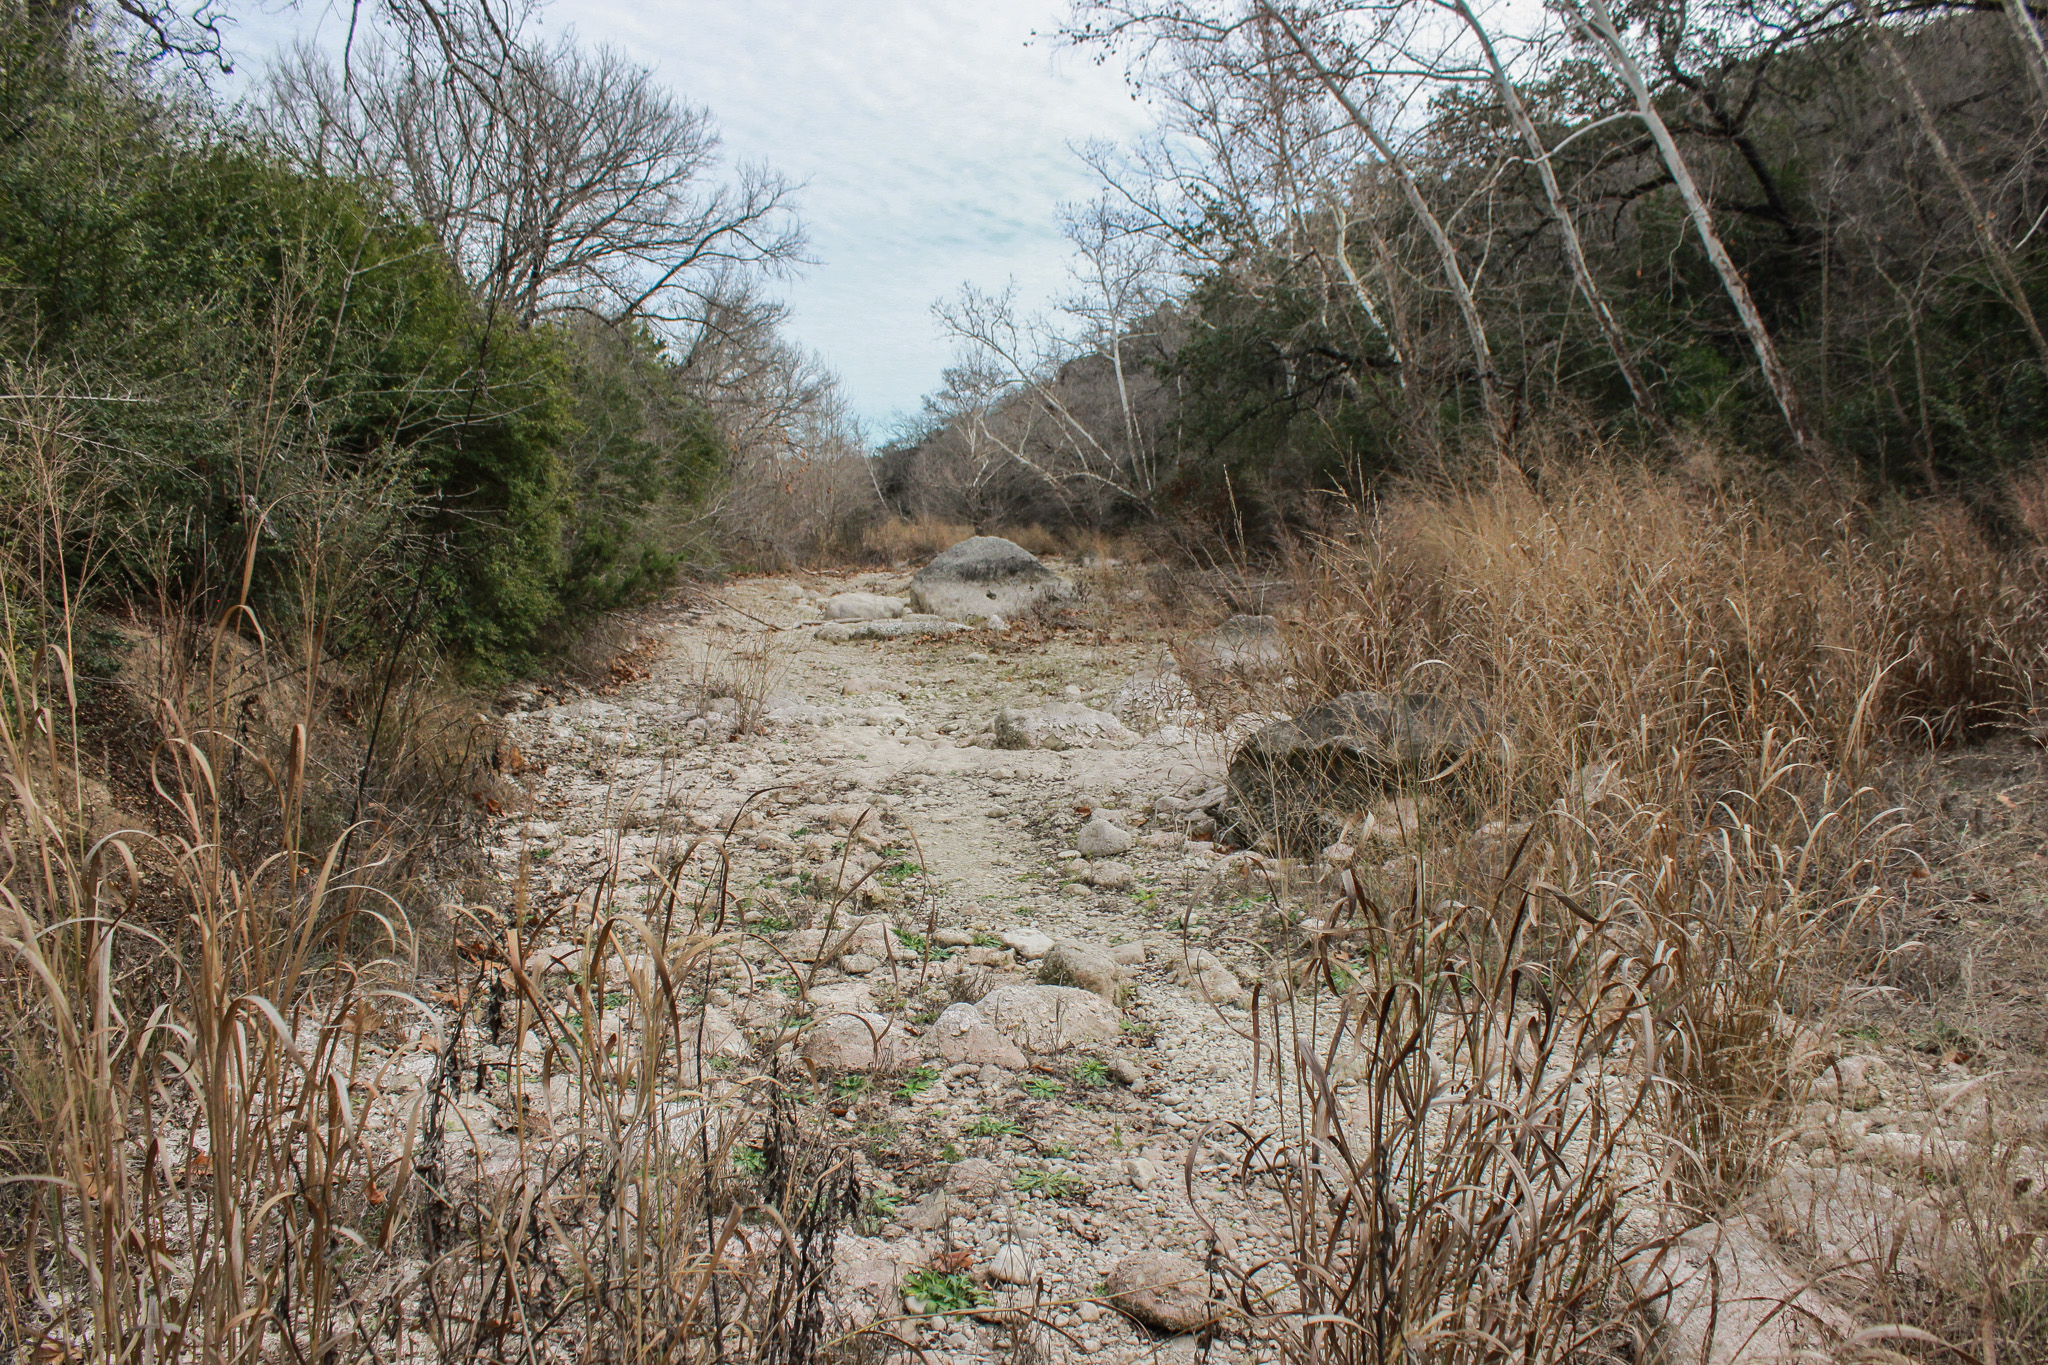
Photo of a dry Barton Creek | January 2025
District’s Current Drought Status: Stage 3 Exceptional Drought
January delivered a true weather roller coaster. The month opened with three record-high temperatures in the first week, only to swing in the opposite direction by the end of the month. During the final week, an Arctic cold front moved through, bringing winter weather and a record daily low maximum temperature of just 29 degrees on January 25.
While the cold front did produce some winter precipitation, it was not enough to make a meaningful impact on local groundwater levels or springflow. Aquifer recharge depends on sustained rainfall that generates flowing creeks and streams across the recharge zone—conditions that unfortunately did not materialize in late January.
The District remains in Stage 3 Exceptional Drought for now but groundwater levels and springflow are approaching Stage 4 Emergency Response Period.
Rainfall Recap
In January the area saw an average of just 1.1 inches between Camp Mabry and Austin Bergstrom International Airport (ABIA), about 1.5 inches below the long-term monthly average (Figure 1). What little moisture we received was a result of the Arctic cold front that hit the area in late January.
Looking ahead, February, typically our driest month of the year, brings about 1.9 inches of rain.
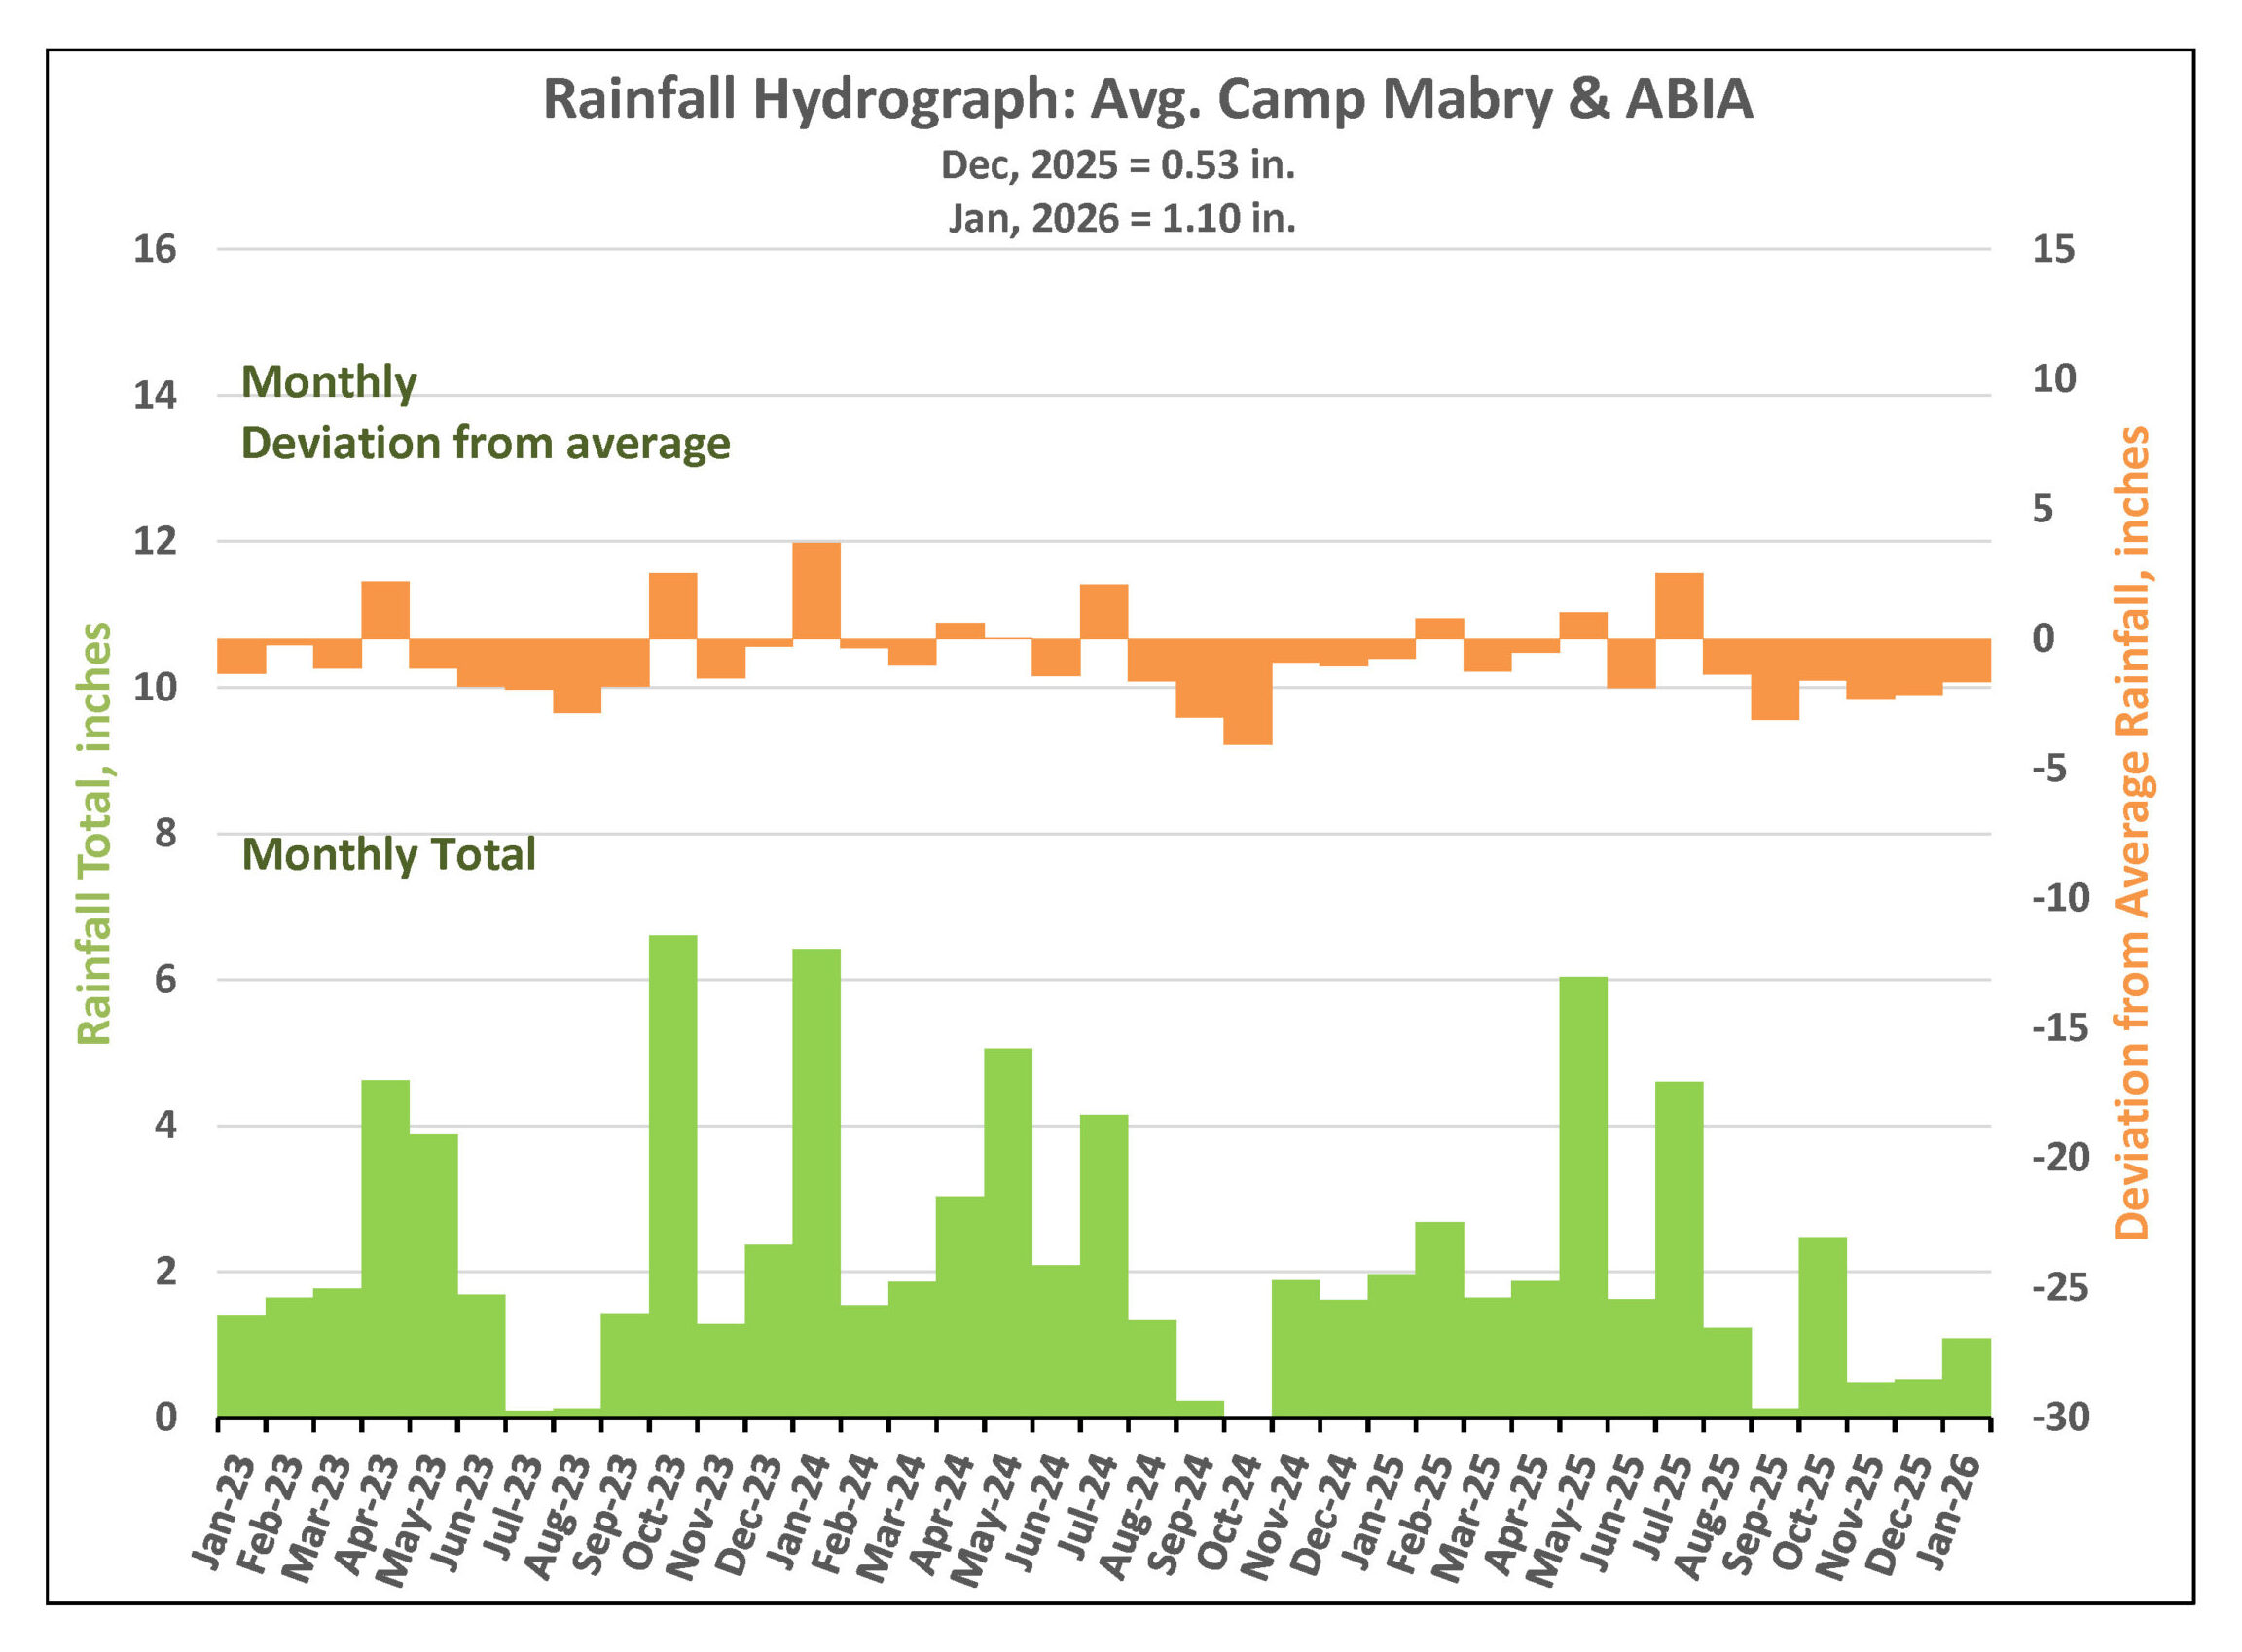
Figure 1. Monthly deviation from average and monthly total rainfall in District’s territory.
Austin Annual Rainfall: Deviation from Average
Figure 2 shows Austin’s annual rainfall departure from average dating back to 2008. While above-average rainfall from 2012 through 2018 helped the aquifer recover from previous drought conditions, the current drought has rapidly depleted those gains. Replenishing the aquifers from their current levels will, once again, require multiple years of significantly above-average rainfall.
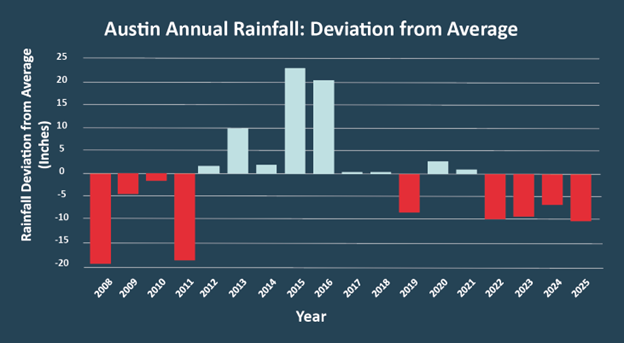
Figure 2. Annual Rainfall deviation from average at Camp Mabry and Austin Bergstrom International Airport since 2008.
Drought Triggers and Status
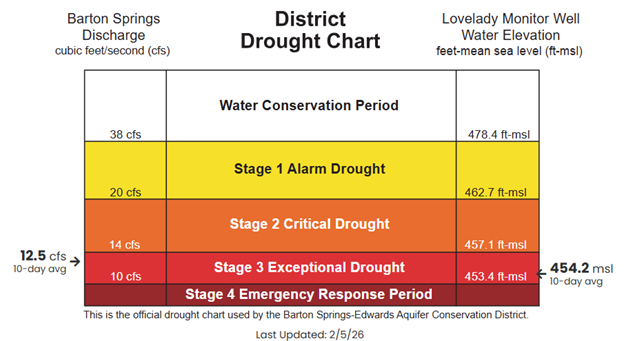
Figure 3. District Drought Chart as of February 5, 2026 displaying 10-day averages for springflow at Barton Springs (left) and groundwater levels at Lovelady monitor well (right)—both of which play a role in determining the District’s drought stage.
Barton Springs Flow
As of February 5, the 10-day average flow at Barton Springs is 12.5 cubic feet per second (cfs). This is still within the Stage 3 Exceptional Drought threshold but just 2.5 cfs above Stage 4 Emergency Response (Figure 4). The District has never declared Stage 4 Emergency Response, but without meaningful rainfall, Barton Springs flows could drop into that range before Spring 2026.
The District and the City of Austin obtained a manual flow measurement at Barton Springs on February 4, 2026. District staff is making manual measurements every 2-3 weeks to closely monitor these low flows.
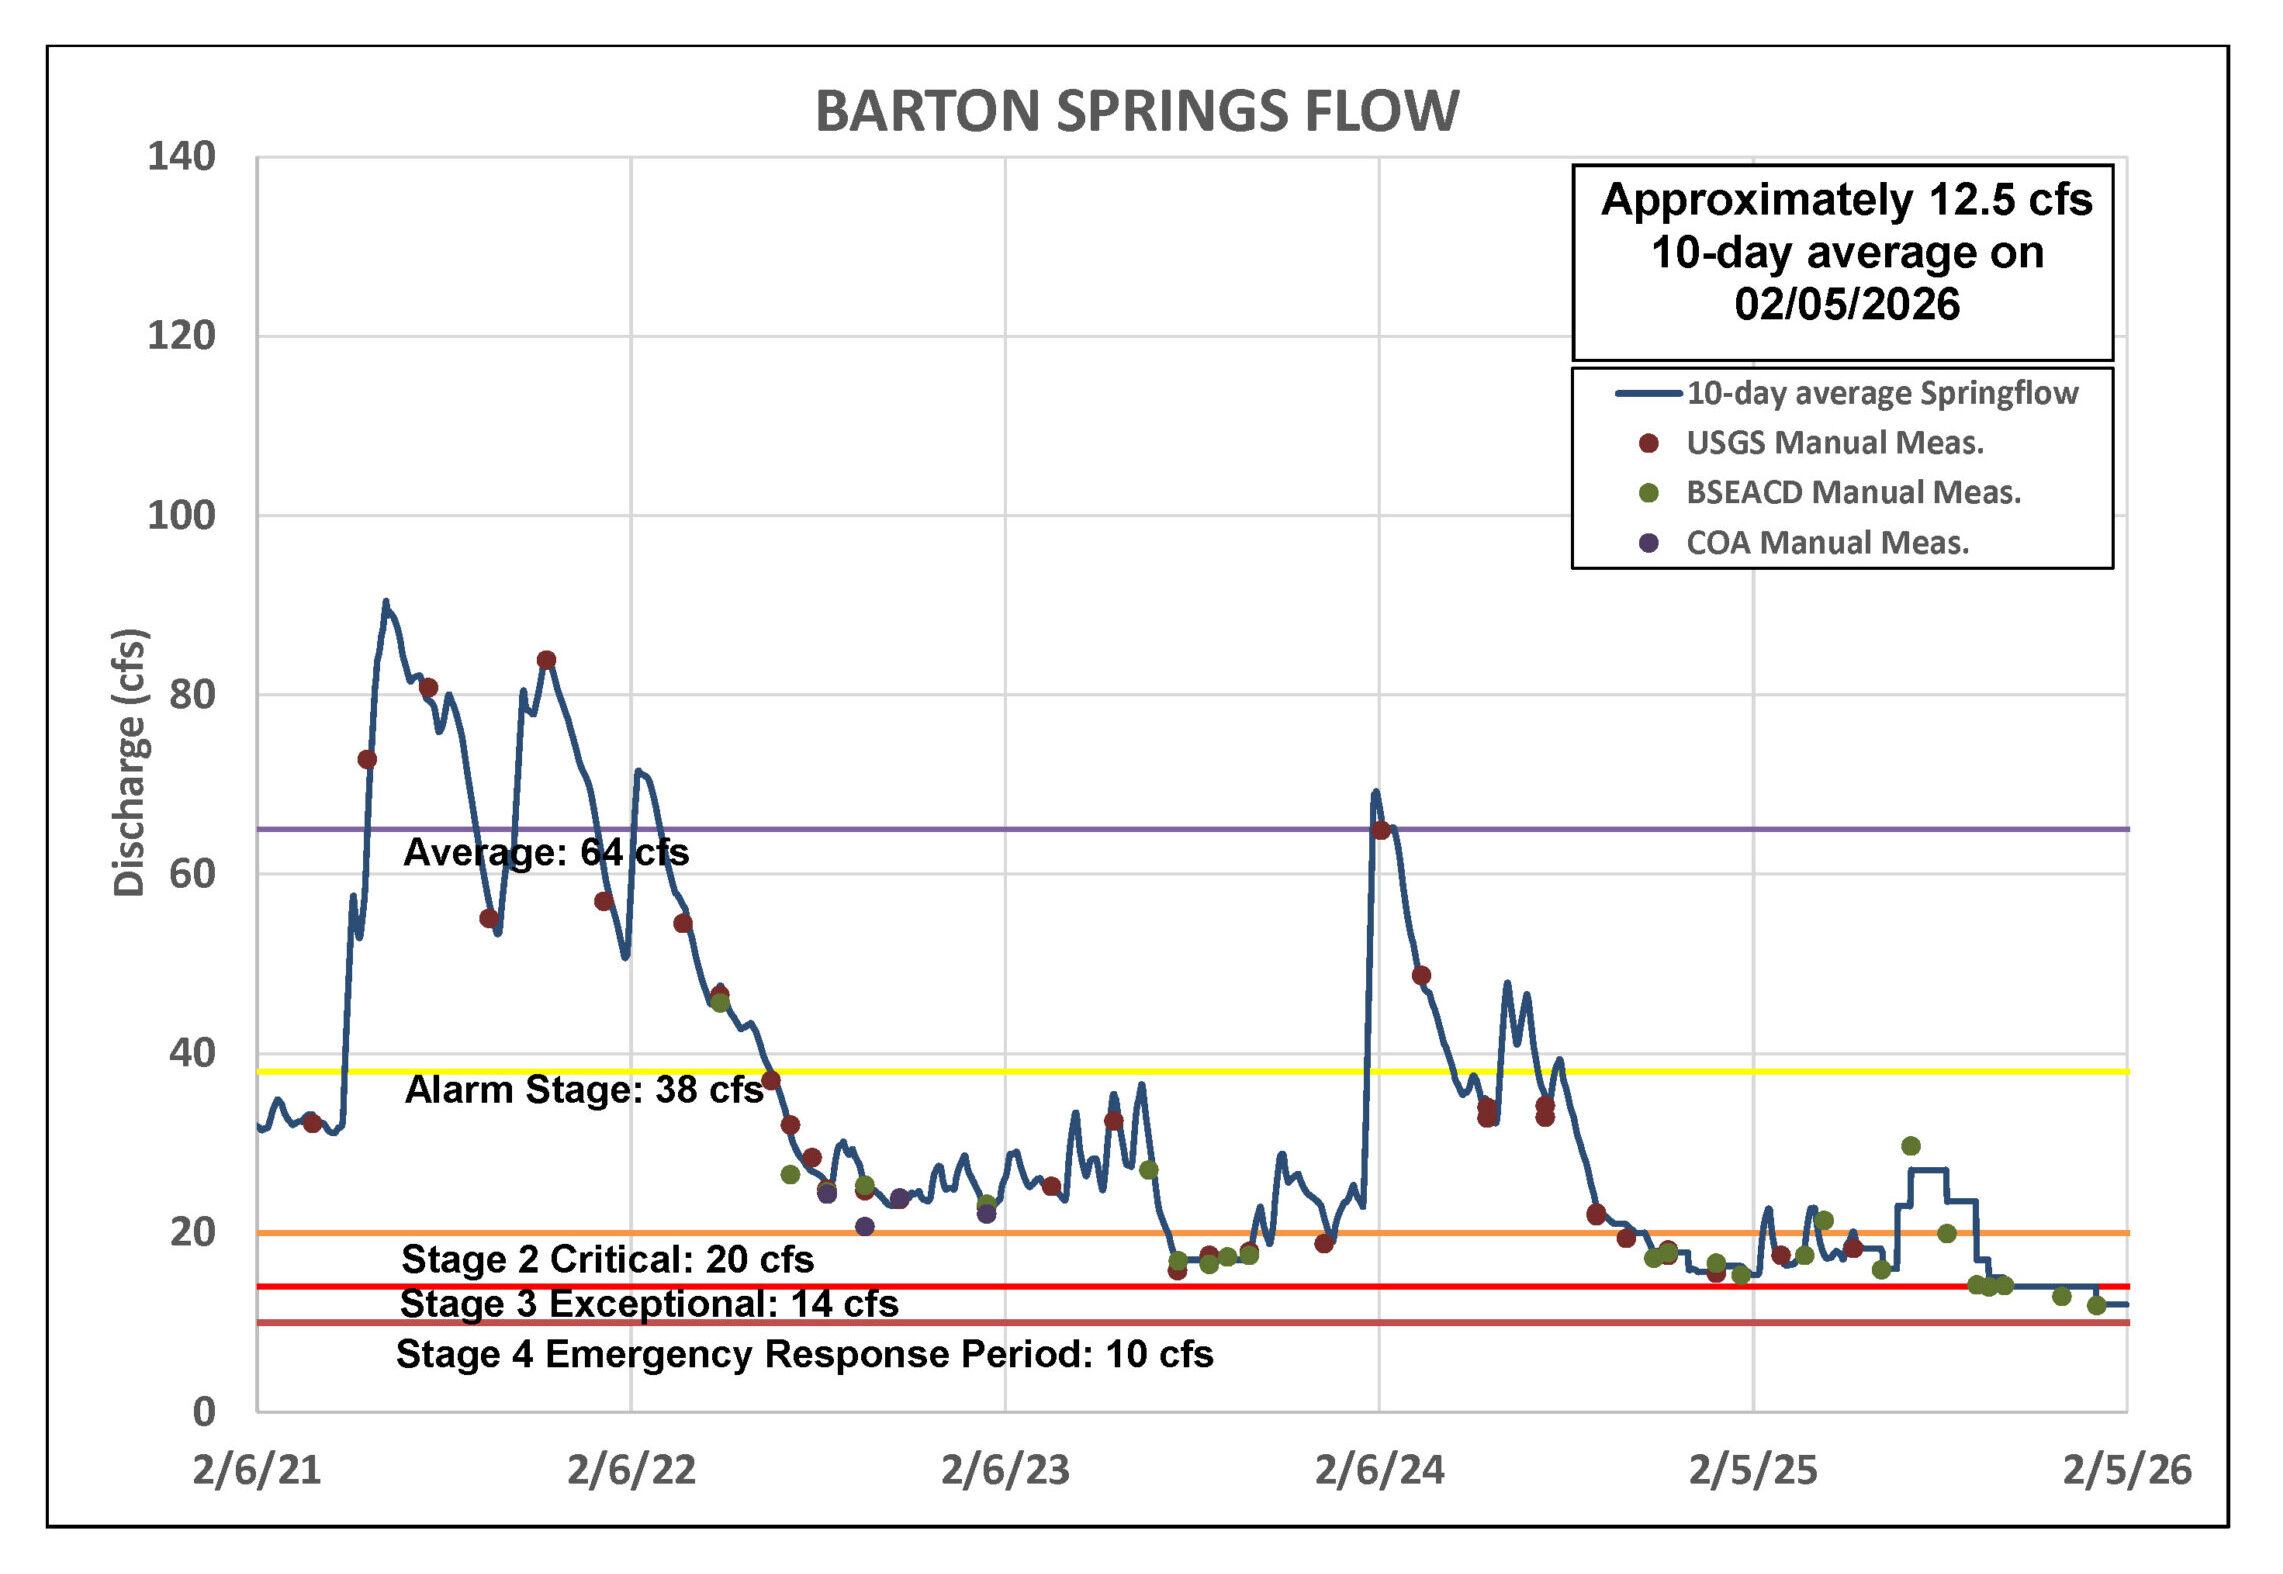
Figure 4. Barton Springs flow for the last five years.
*Note: Recent data for Barton Springs looks blockier than earlier, smoother records because it’s based on the average of two recent manual measurements, rather than continuous USGS gauge data.
Lovelady Monitor Well
As of February 5, the 10-day average water level at the Lovelady well is 454.2 feet above mean sea level (ft-msl). This is within the Stage 3 Exceptional Drought range but is only 0.8 feet (or 9.6 inches) above the Stage 4 Emergency Response threshold (Figure 5). Like Barton Springs, water levels could slip into Stage 4 Emergency Response by late March or early April 2026 if significant rainfall does not arrive.
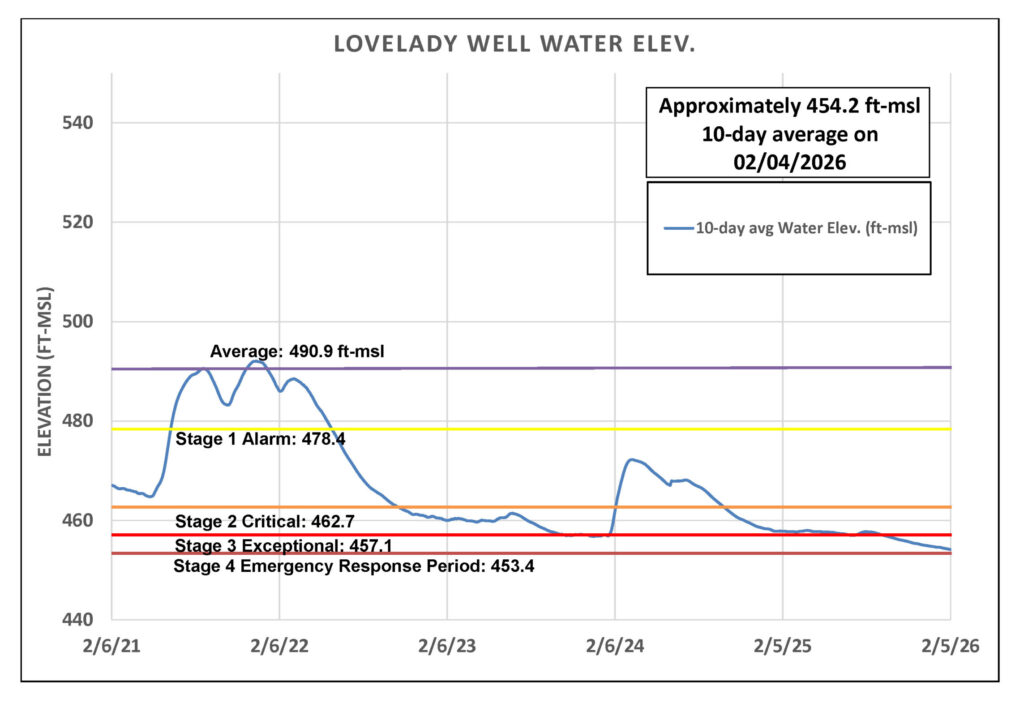
Figure 5. Lovelady groundwater level over the last five years.
Trinity Aquifer
The Lowe-Coronado Middle Trinity monitor well continues to show a steep decline in groundwater levels, reaching historic lows (Figure 6). This downward trend mirrors conditions across the region, including in the overlying Upper Trinity Aquifer.
As of January 8, the 10-day average flow at Jacob’s Well Spring (JWS) is zero cubic feet per second (cfs) and has been reporting zero flow since November 2025. The Blanco River at Wimberley is maintaining flows between 6-8 cfs.
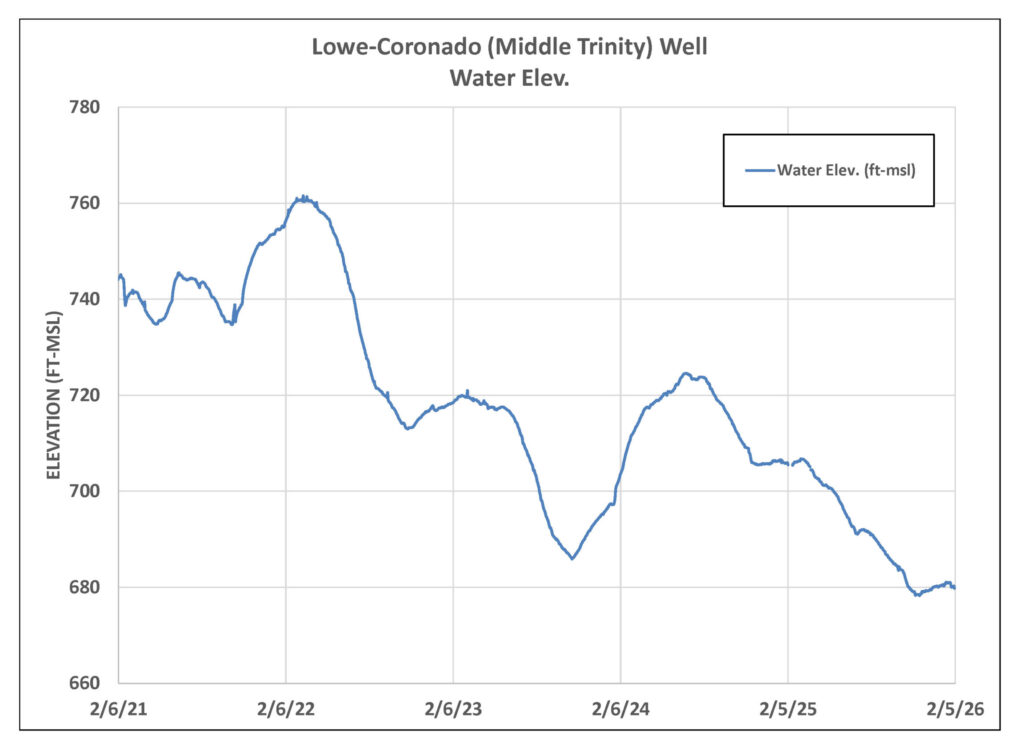
Figure 6. Lowe-Coronado (Middle Trinity) monitor well water-level elevation.
Outlook
The National Oceanic and Atmospheric Administration’s (NOAA) three-month outlook forecasts a continuation of below average rainfall and above average temperatures for the southern portion of the United States. La Niña conditions are weakening, which could lead to periodic rain chances from Pacific storm systems in February.
Figure 7. NOAA seasonal precipitation outlook for February – April 2026.