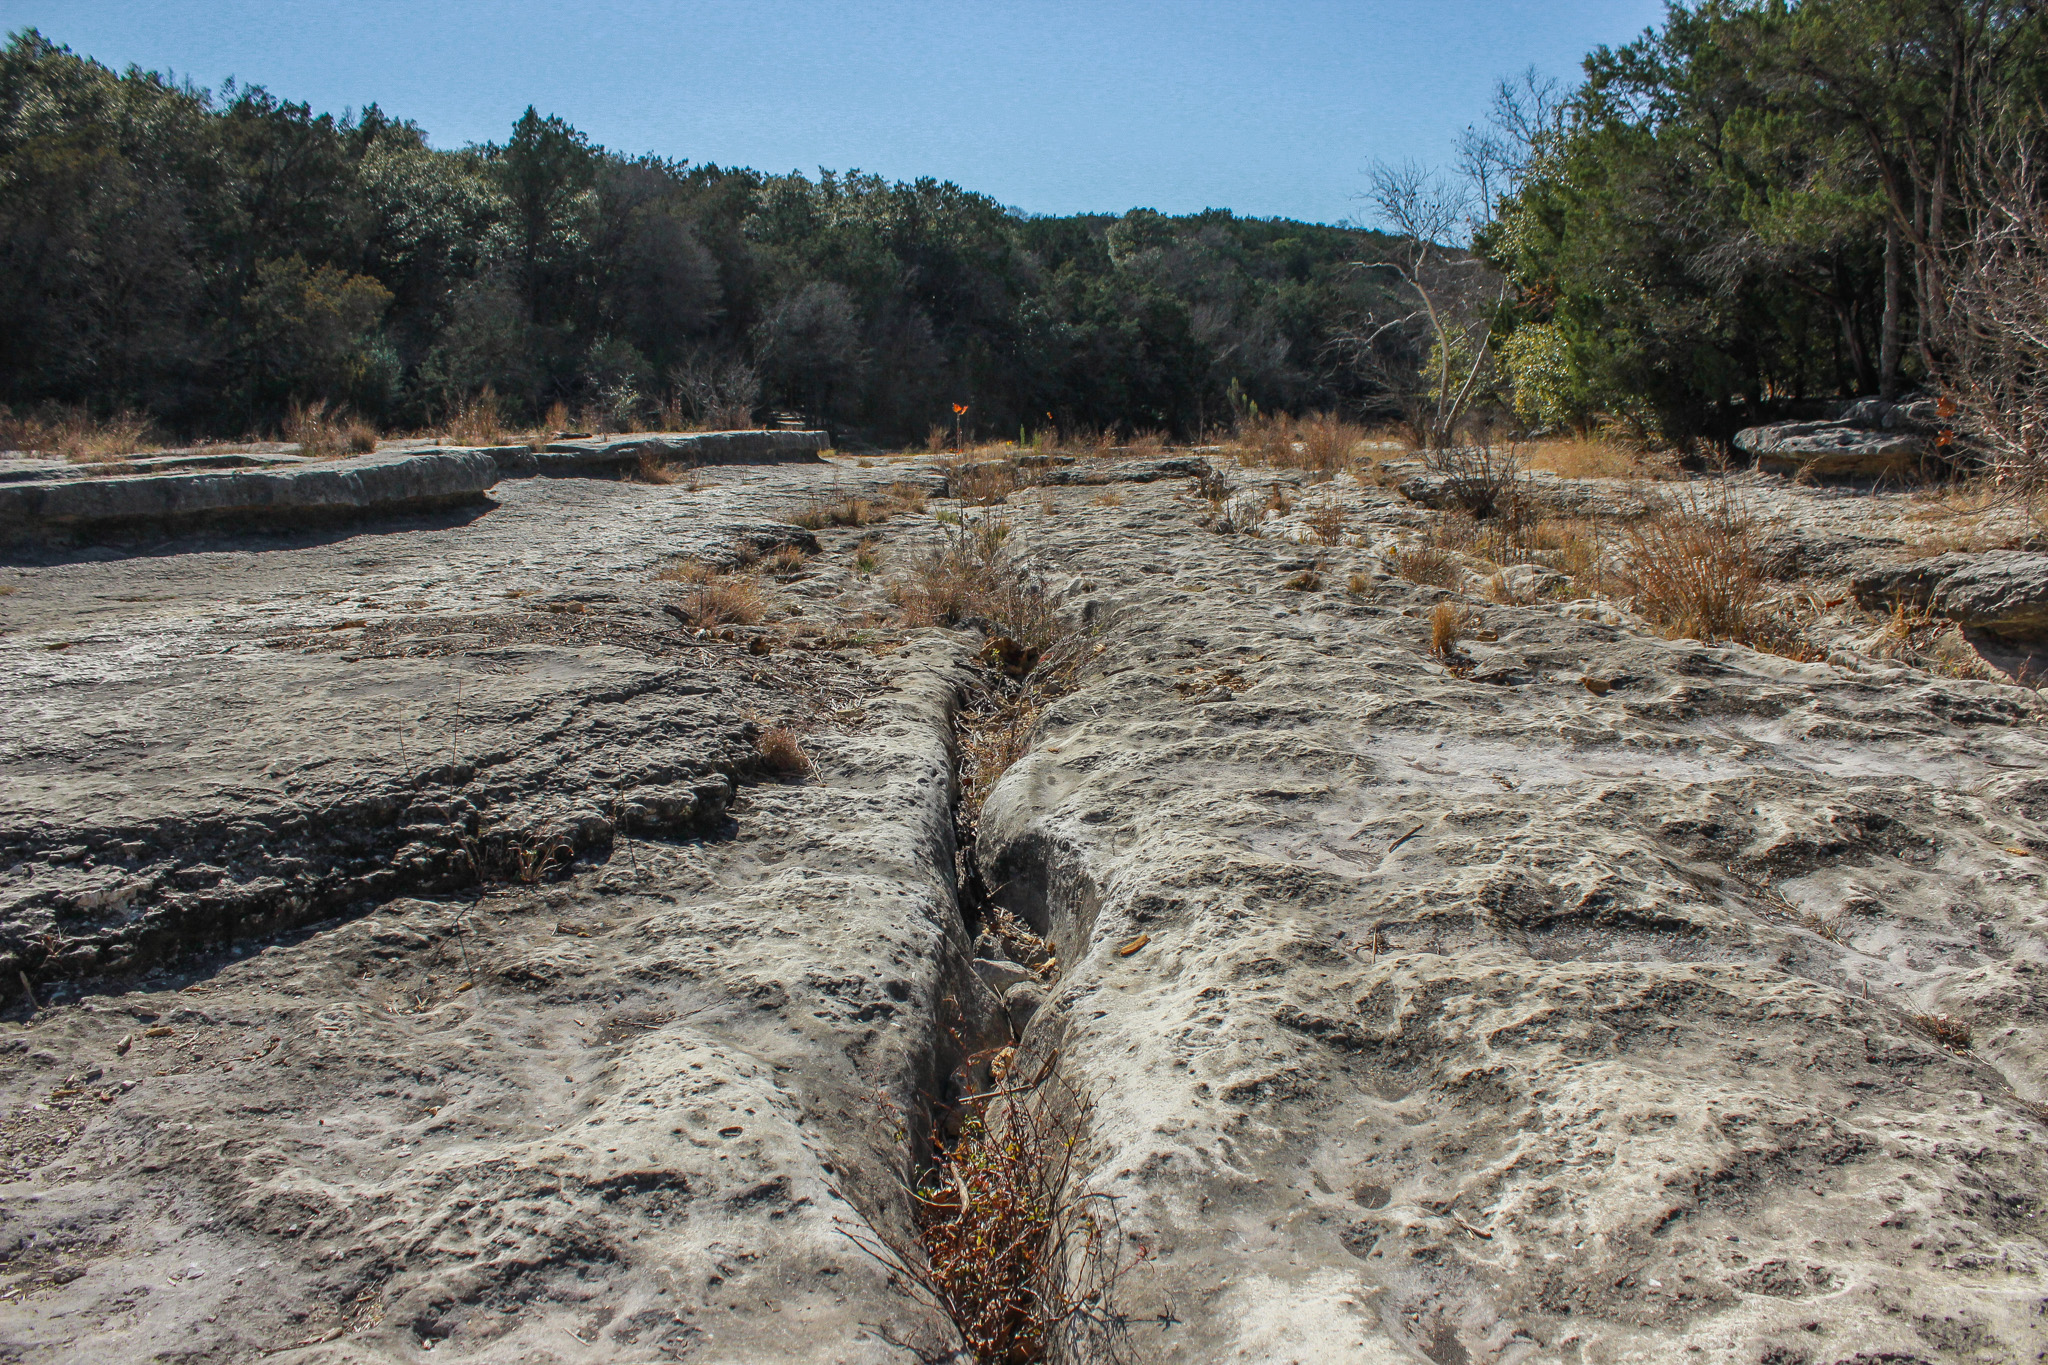
Photo of a dry Barton Creek | February 2026
District’s Current Drought Status: Stage 3 Exceptional Drought
After delivering the warmest February on record, 2026 has now produced a record-breaking March as well. The month concluded with an average temperature of 70.8°F, which is nearly two degrees higher than the previous record set in 1907 when March averaged 68.9°F. Rainfall was also below average, with the area receiving just over half of its typical March total. Despite the limited precipitation, conditions were sufficient to delay a Stage 4 Emergency declaration, leaving the District in Stage 3 Exceptional drought.
Rainfall Recap
Total March rainfall across the Austin–Hill Country area averaged just 1.1 inches between Camp Mabry and ABIA, about 1.8 inches below the long-term monthly average (Figure 1). April typically brings about 2.4 inches of rainfall. Through April 7, approximately 1.6 inches of rain has fallen in the Austin area, about 1.5 inches in the Driftwood and Wimberley areas, and more than 3 inches in parts of San Marcos.
This rainfall produced only brief, minimal flow in Onion, Barton, and Slaughter creeks (Figure 2). Sustained flow in creeks and streams over the recharge zone is critical, as it allows water to seep into cracks, fissures, and caves and replenishes groundwater supplies. Now that soils across the recharge zone have been thoroughly saturated, any additional rainfall later this week will have a greater chance of infiltrating the aquifers and boosting groundwater levels.
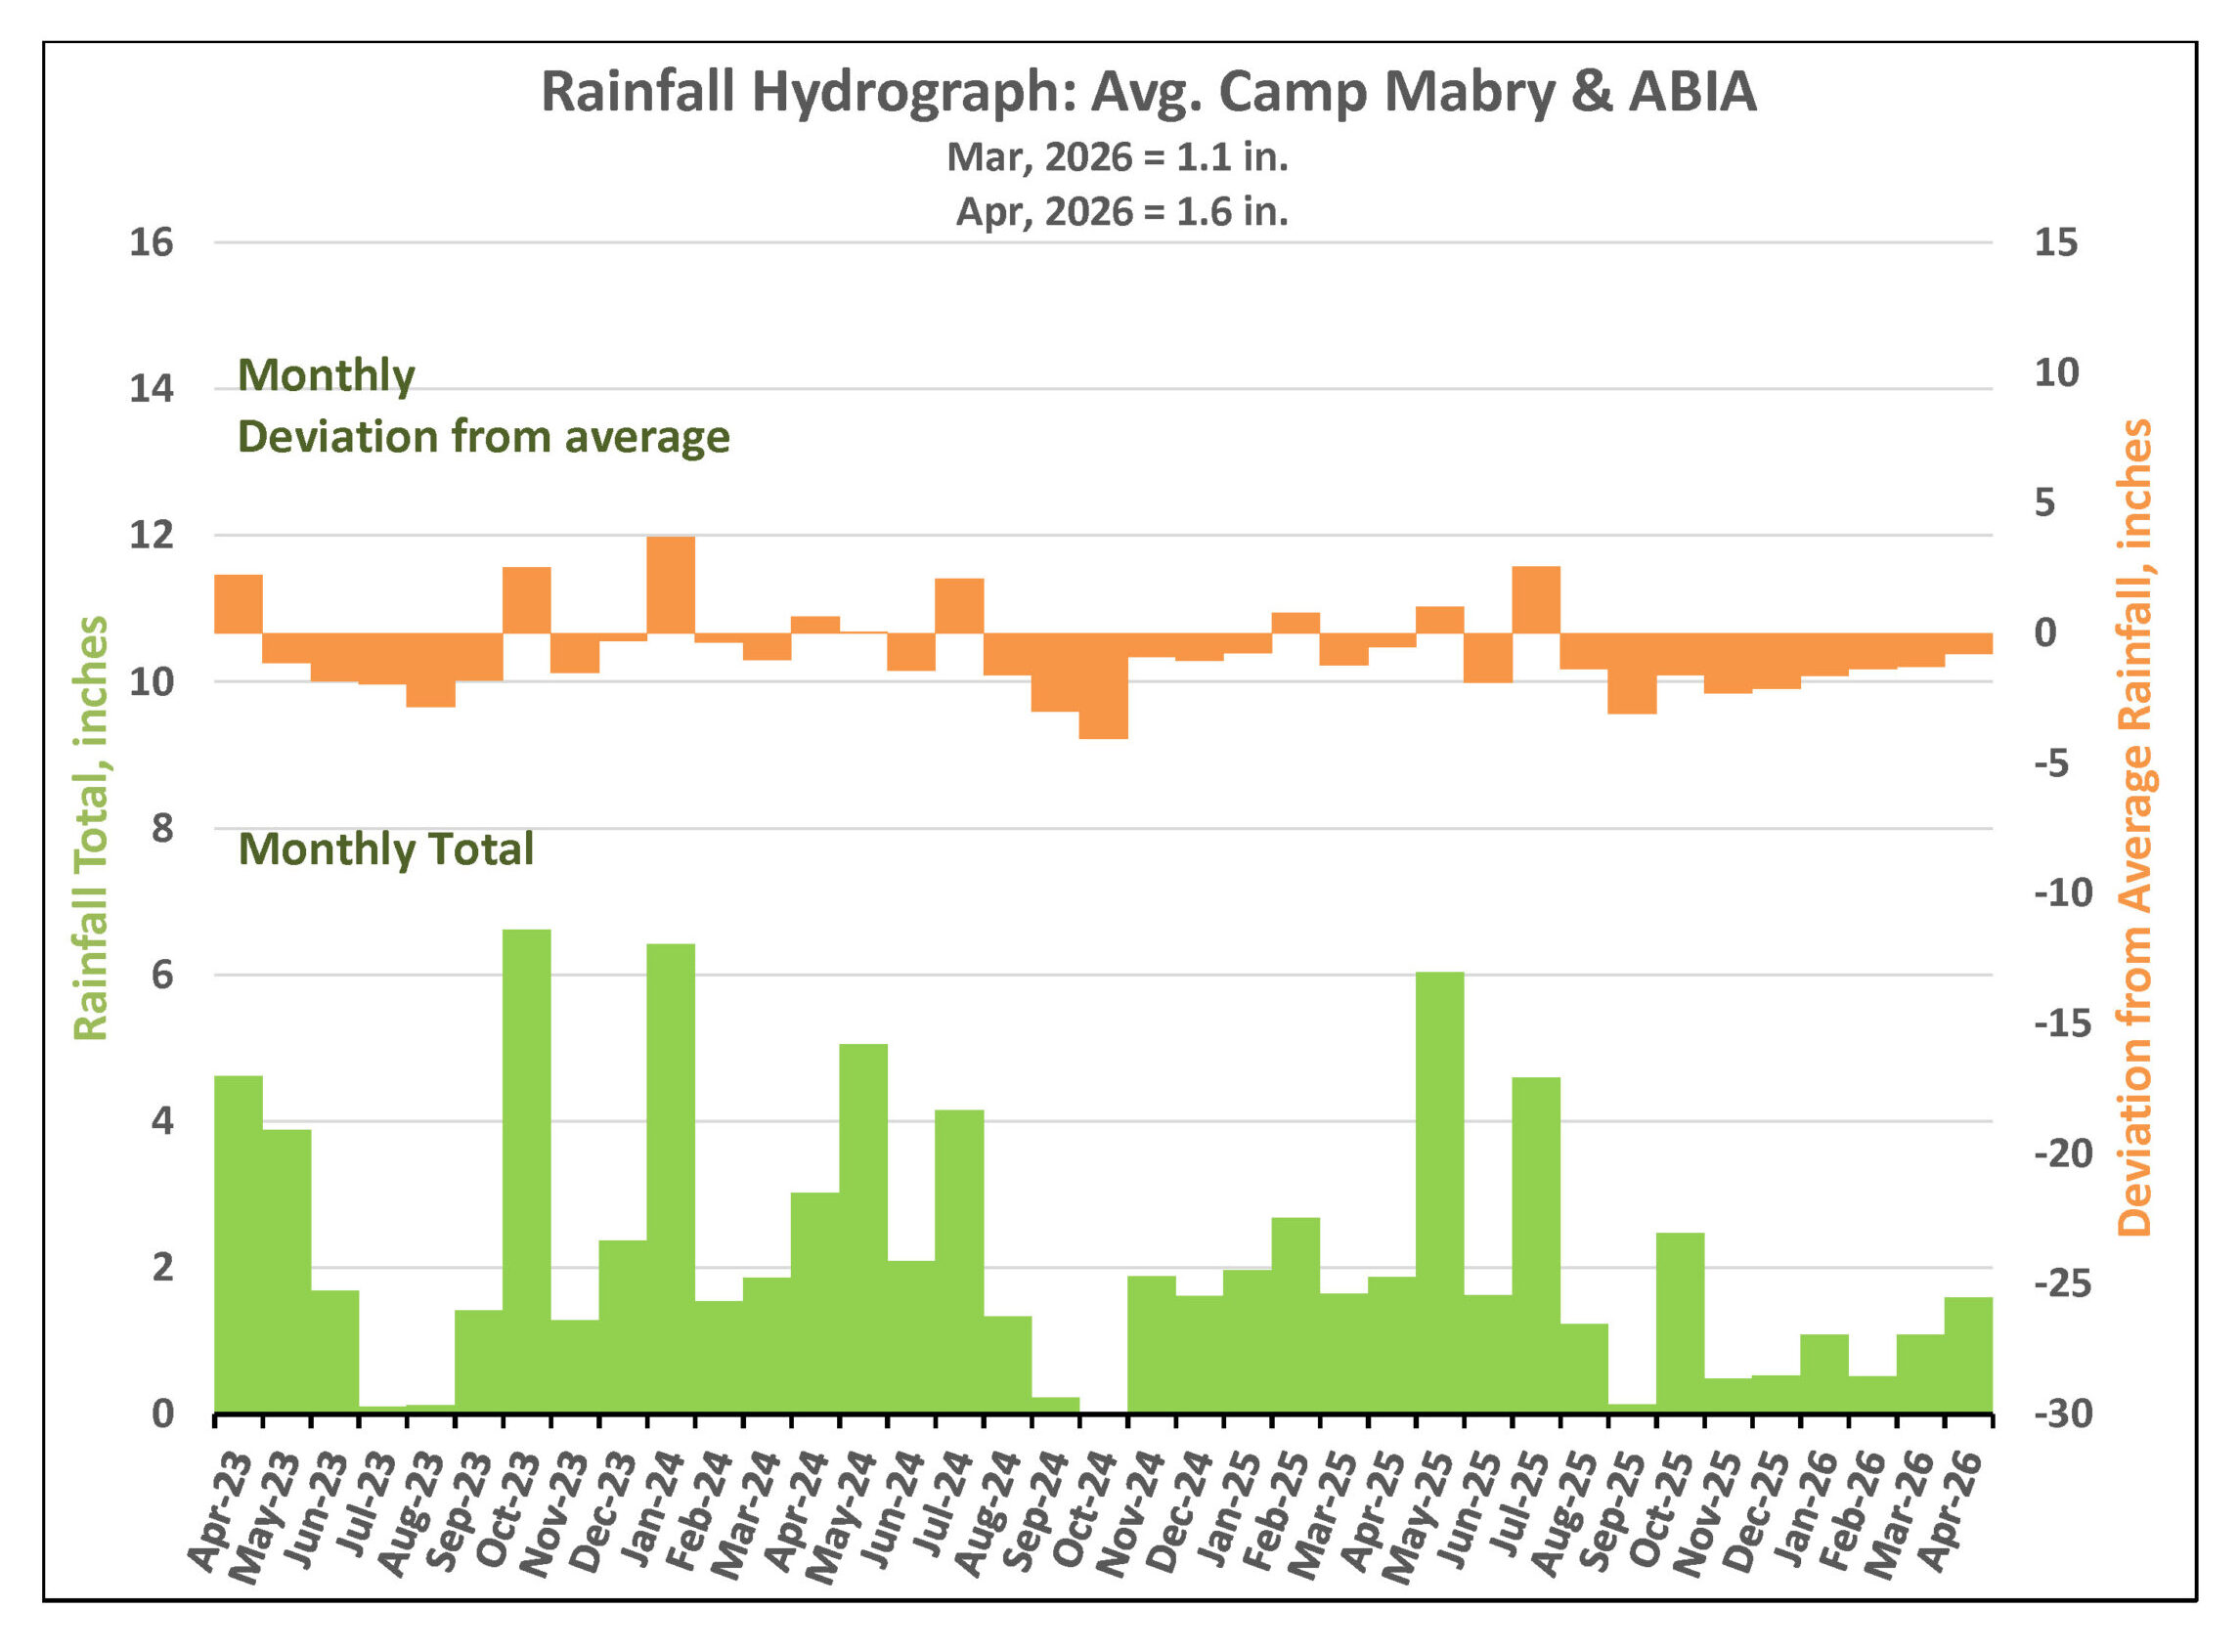
Figure 1. Monthly deviation from average and monthly total rainfall in District’s territory.
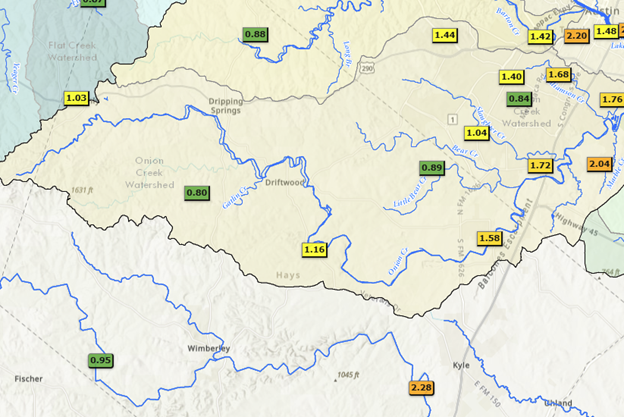
Figure 2. Rainfall over the last week from Austin and past Dripping Springs according to LCRA’s hydromet.
Drought Triggers and Status
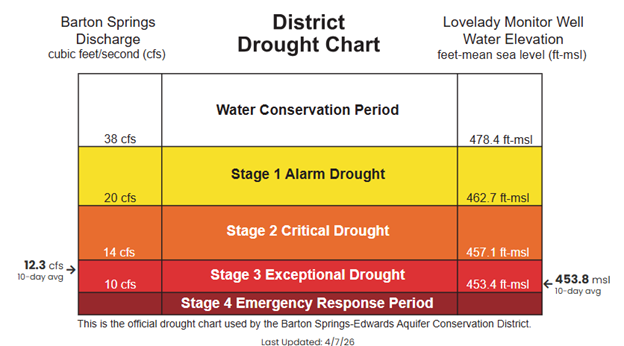
Figure 3. District Drought Chart as of 4/7/2026 displaying 10-day averages for springflow at Barton Springs (left) and groundwater levels at Lovelady monitor well (right)—both of which play a role in determining the District’s drought stage.
Barton Springs Flow
As of April 7, the 10-day average discharge at Barton Springs is 12.3 cubic feet per second (cfs). One cubic foot is roughly the amount of water it takes to fill a standard beach ball. This means only a little over 12 beach balls worth of water are coming out of the springs right now.
Springflow is currently just 2.3 cfs above the Stage 4 Emergency Response threshold (Figure 4). Although flows showed a brief uptick following early April rainfall, the magnitude and duration of that increase were not enough to reverse the overall decline toward Stage 4 conditions. The District has never entered Stage 4 Emergency Response, but without substantial recharge, flows could approach that threshold later this spring.
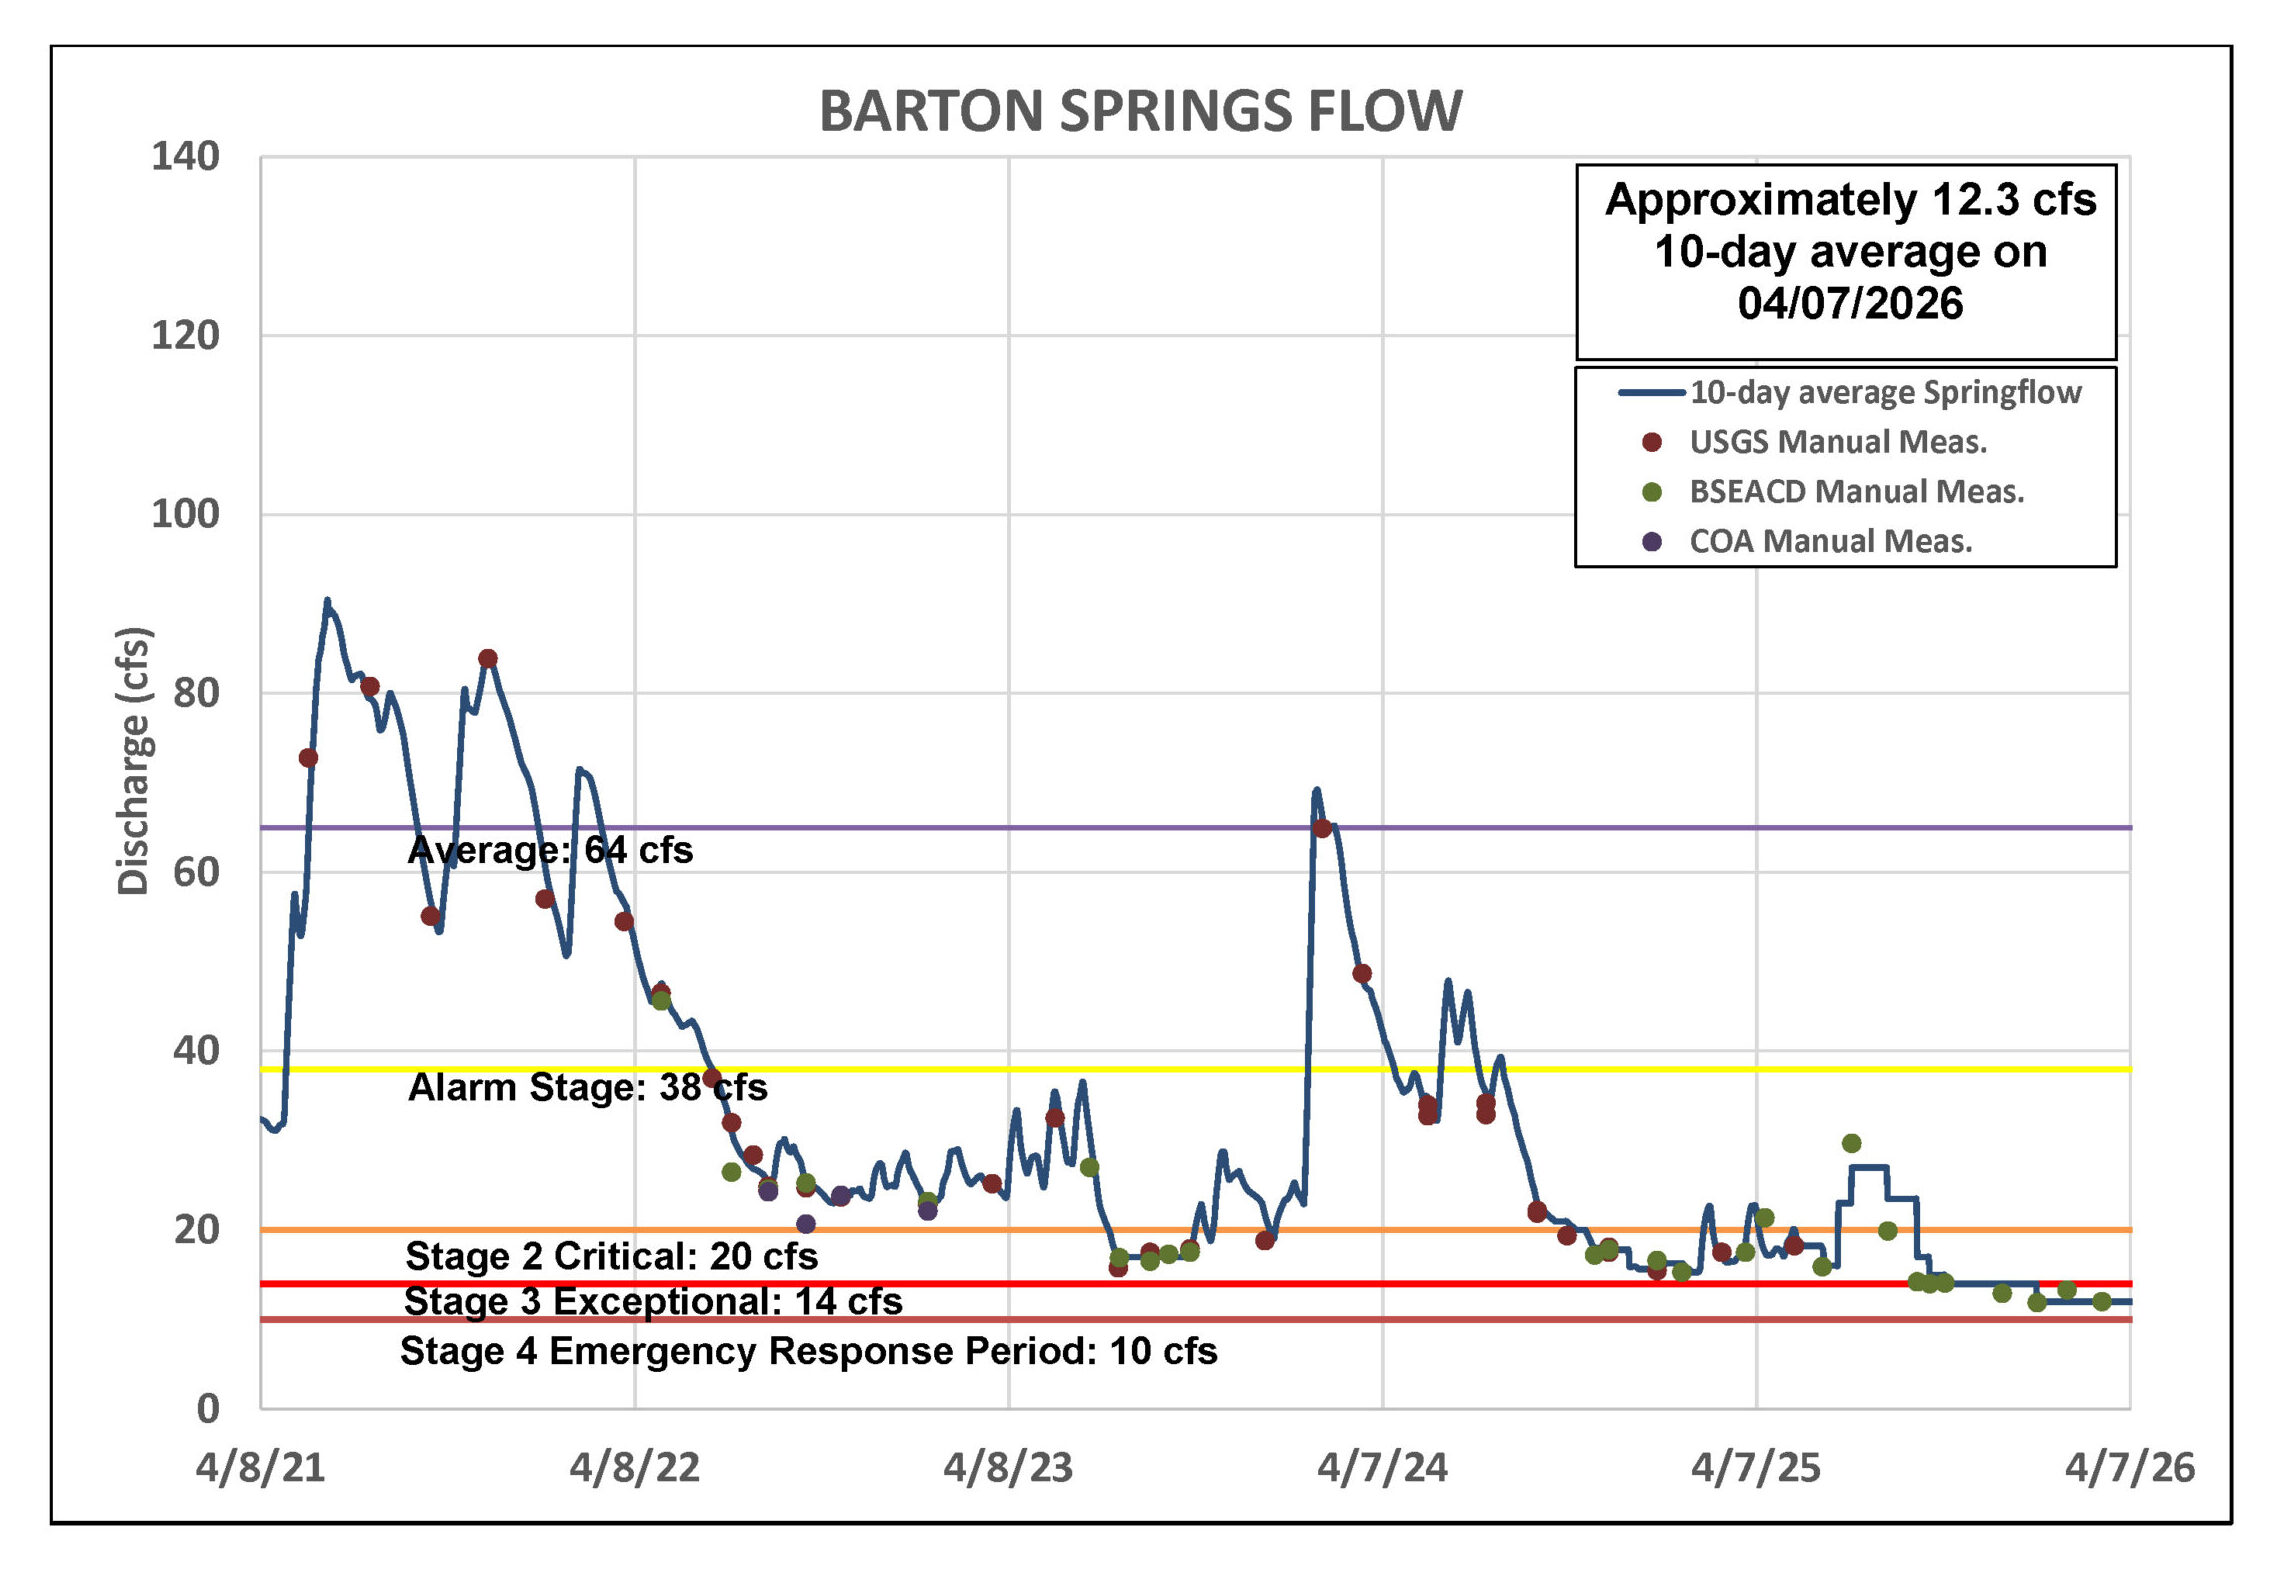
Figure 4. Barton Springs flow for the last five years.
*Note: Recent data for Barton Springs looks blockier than earlier, smoother records because it’s based on the average of two recent manual measurements, rather than continuous USGS gauge data.
Lovelady Monitor Well
As of April 7, the 10-day average water level at the Lovelady well is 453.8 feet above mean sea level (ft-msl), which is within the Stage 3 Exceptional Drought range. This is only 0.4 feet (or 5 inches) above the Stage 4 Emergency Response threshold.
Similar to conditions at Barton Springs, water levels could decline into Stage 4 Emergency Response if significant rainfall does not occur. The limited rainfall that has occurred recently has essentially stabilized water levels and springflow, with little rise or decline, temporarily delaying a potential transition into Stage 4 Emergency.
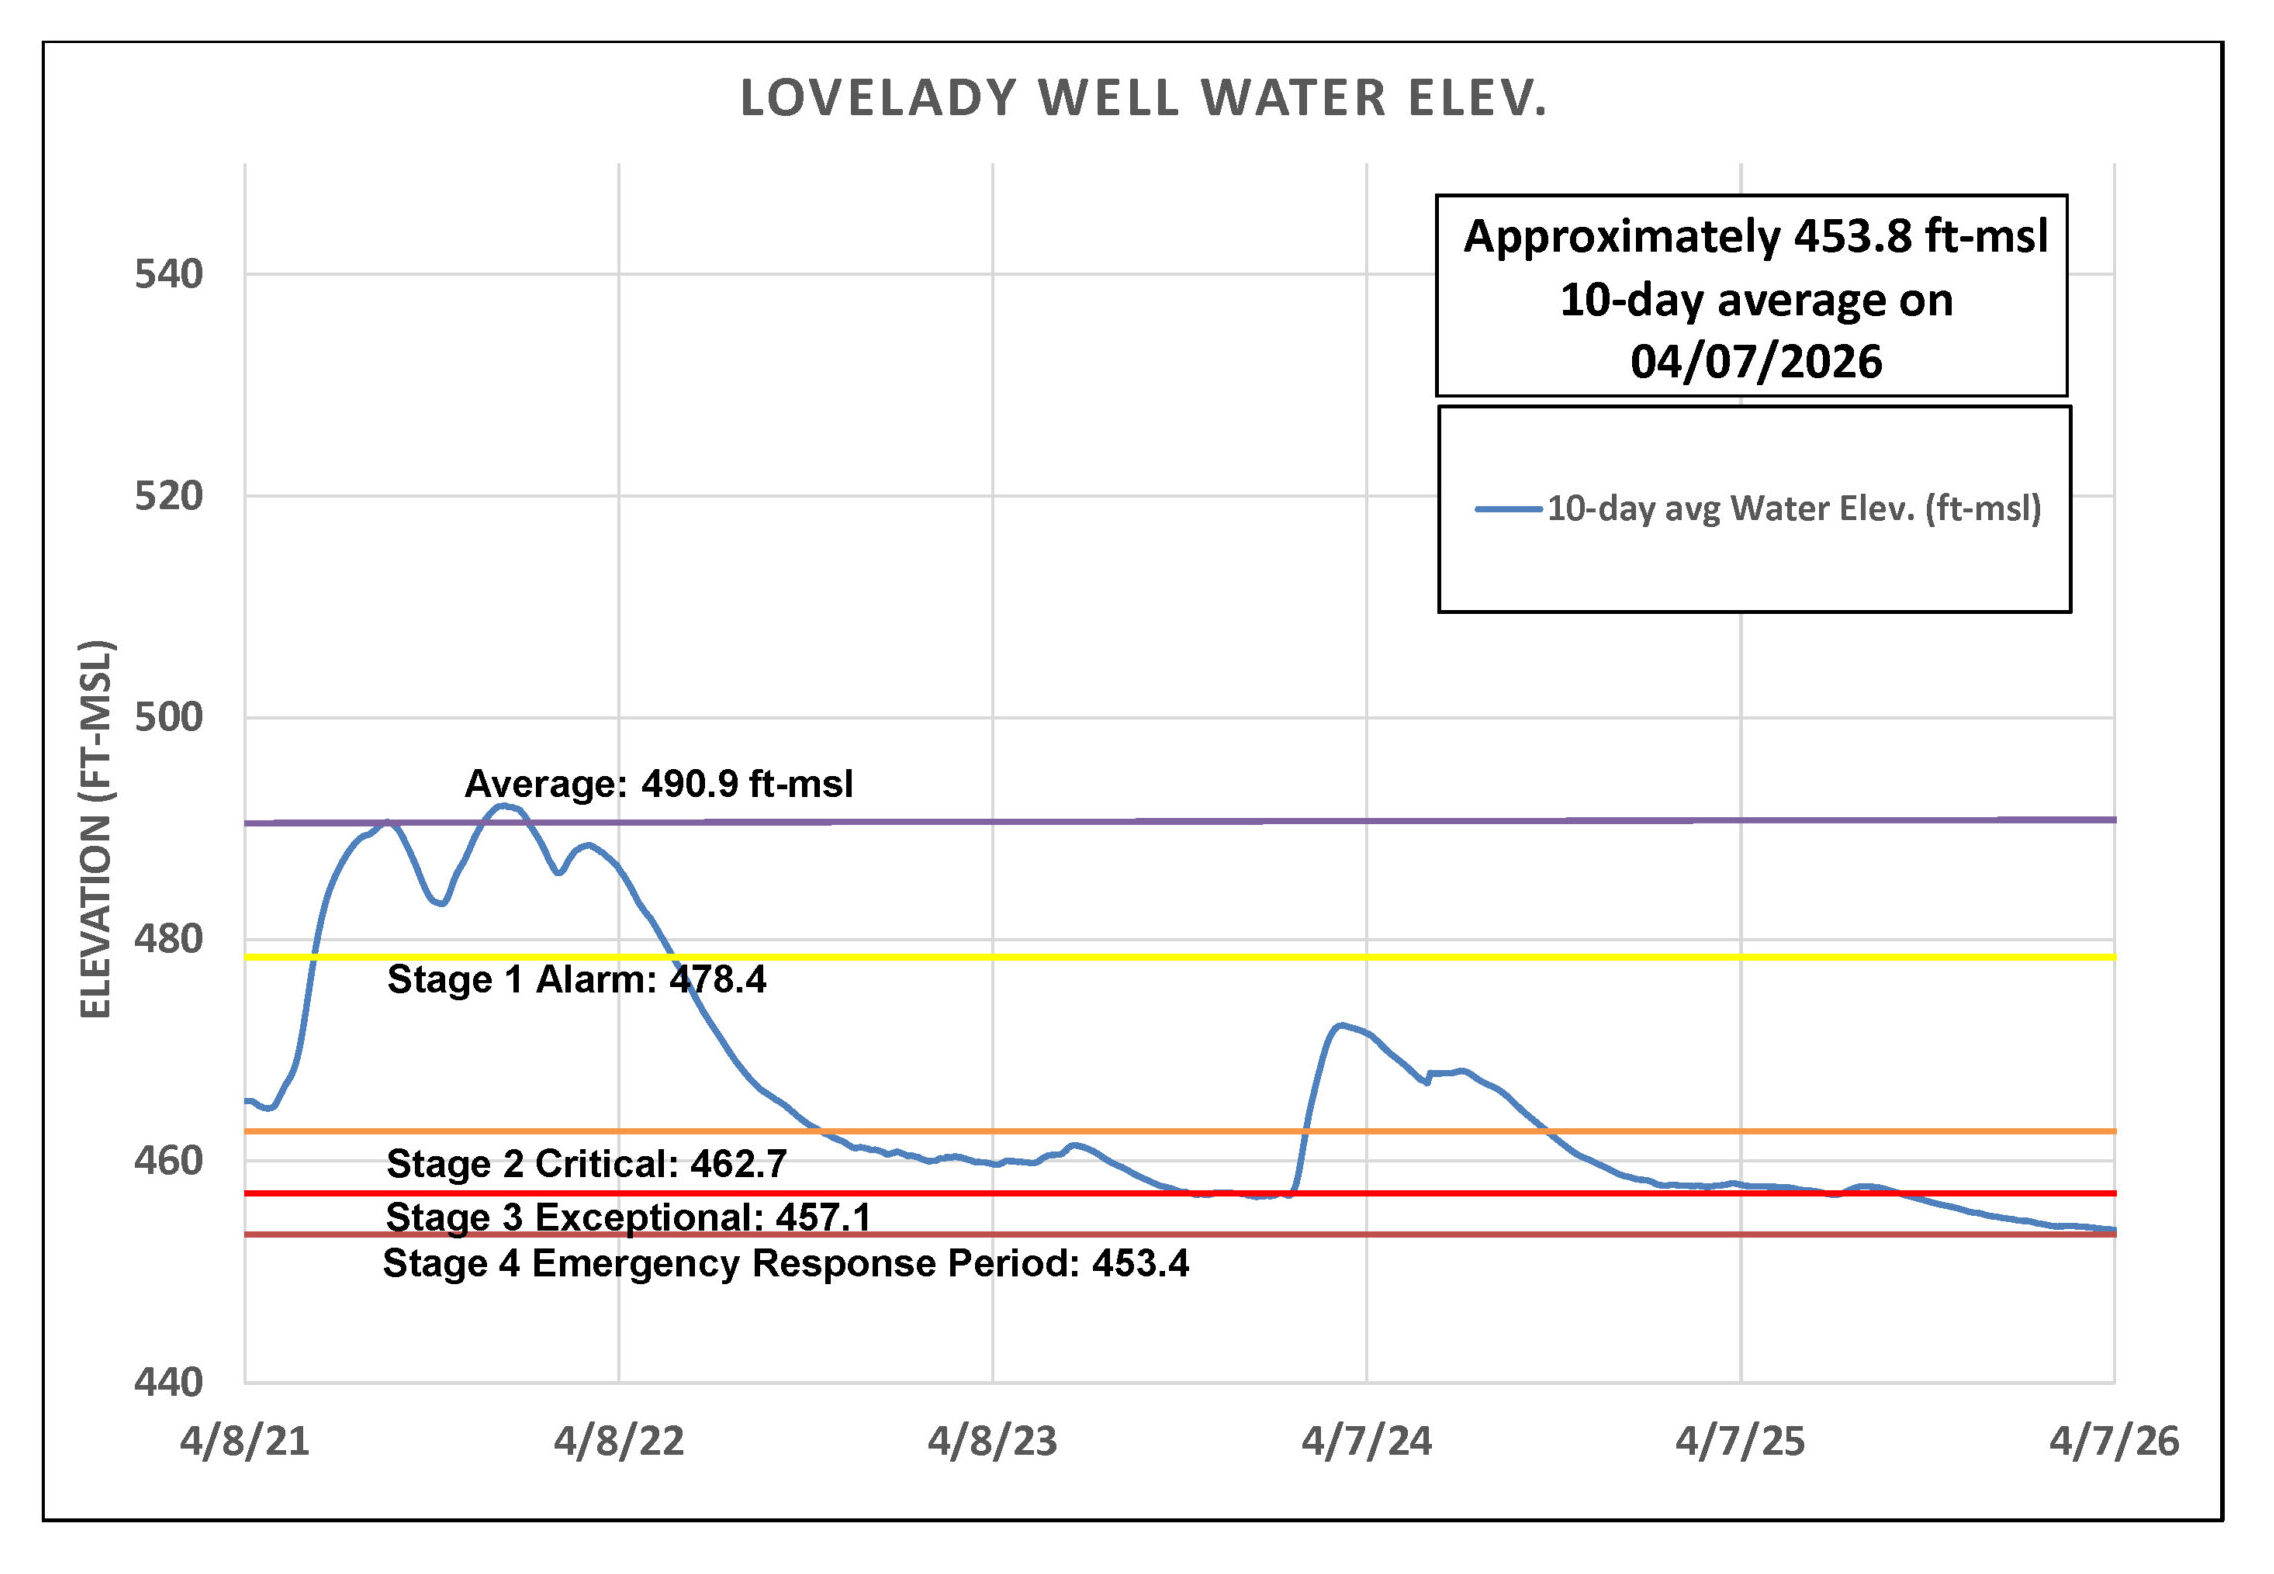
Figure 5. Lovelady groundwater level over the last five years.
Trinity Aquifer
The Lowe-Coronado Middle Trinity monitor well in the Rolling Oaks neighborhood showed a brief increase in water levels beginning in mid-March, but levels have since resumed their decline (Figure 6). This short-term rise is likely due to reduced winter pumping rather than recharge from rainfall, as precipitation during this period has been minimal.
As of April 7, the 10-day average flow at Jacob’s Well Spring (JWS) is 0.00 cubic feet per second (cfs) and has been reporting 0.00 flow since November 2025. The Blanco River at Wimberley is maintaining flows around 4 cfs.
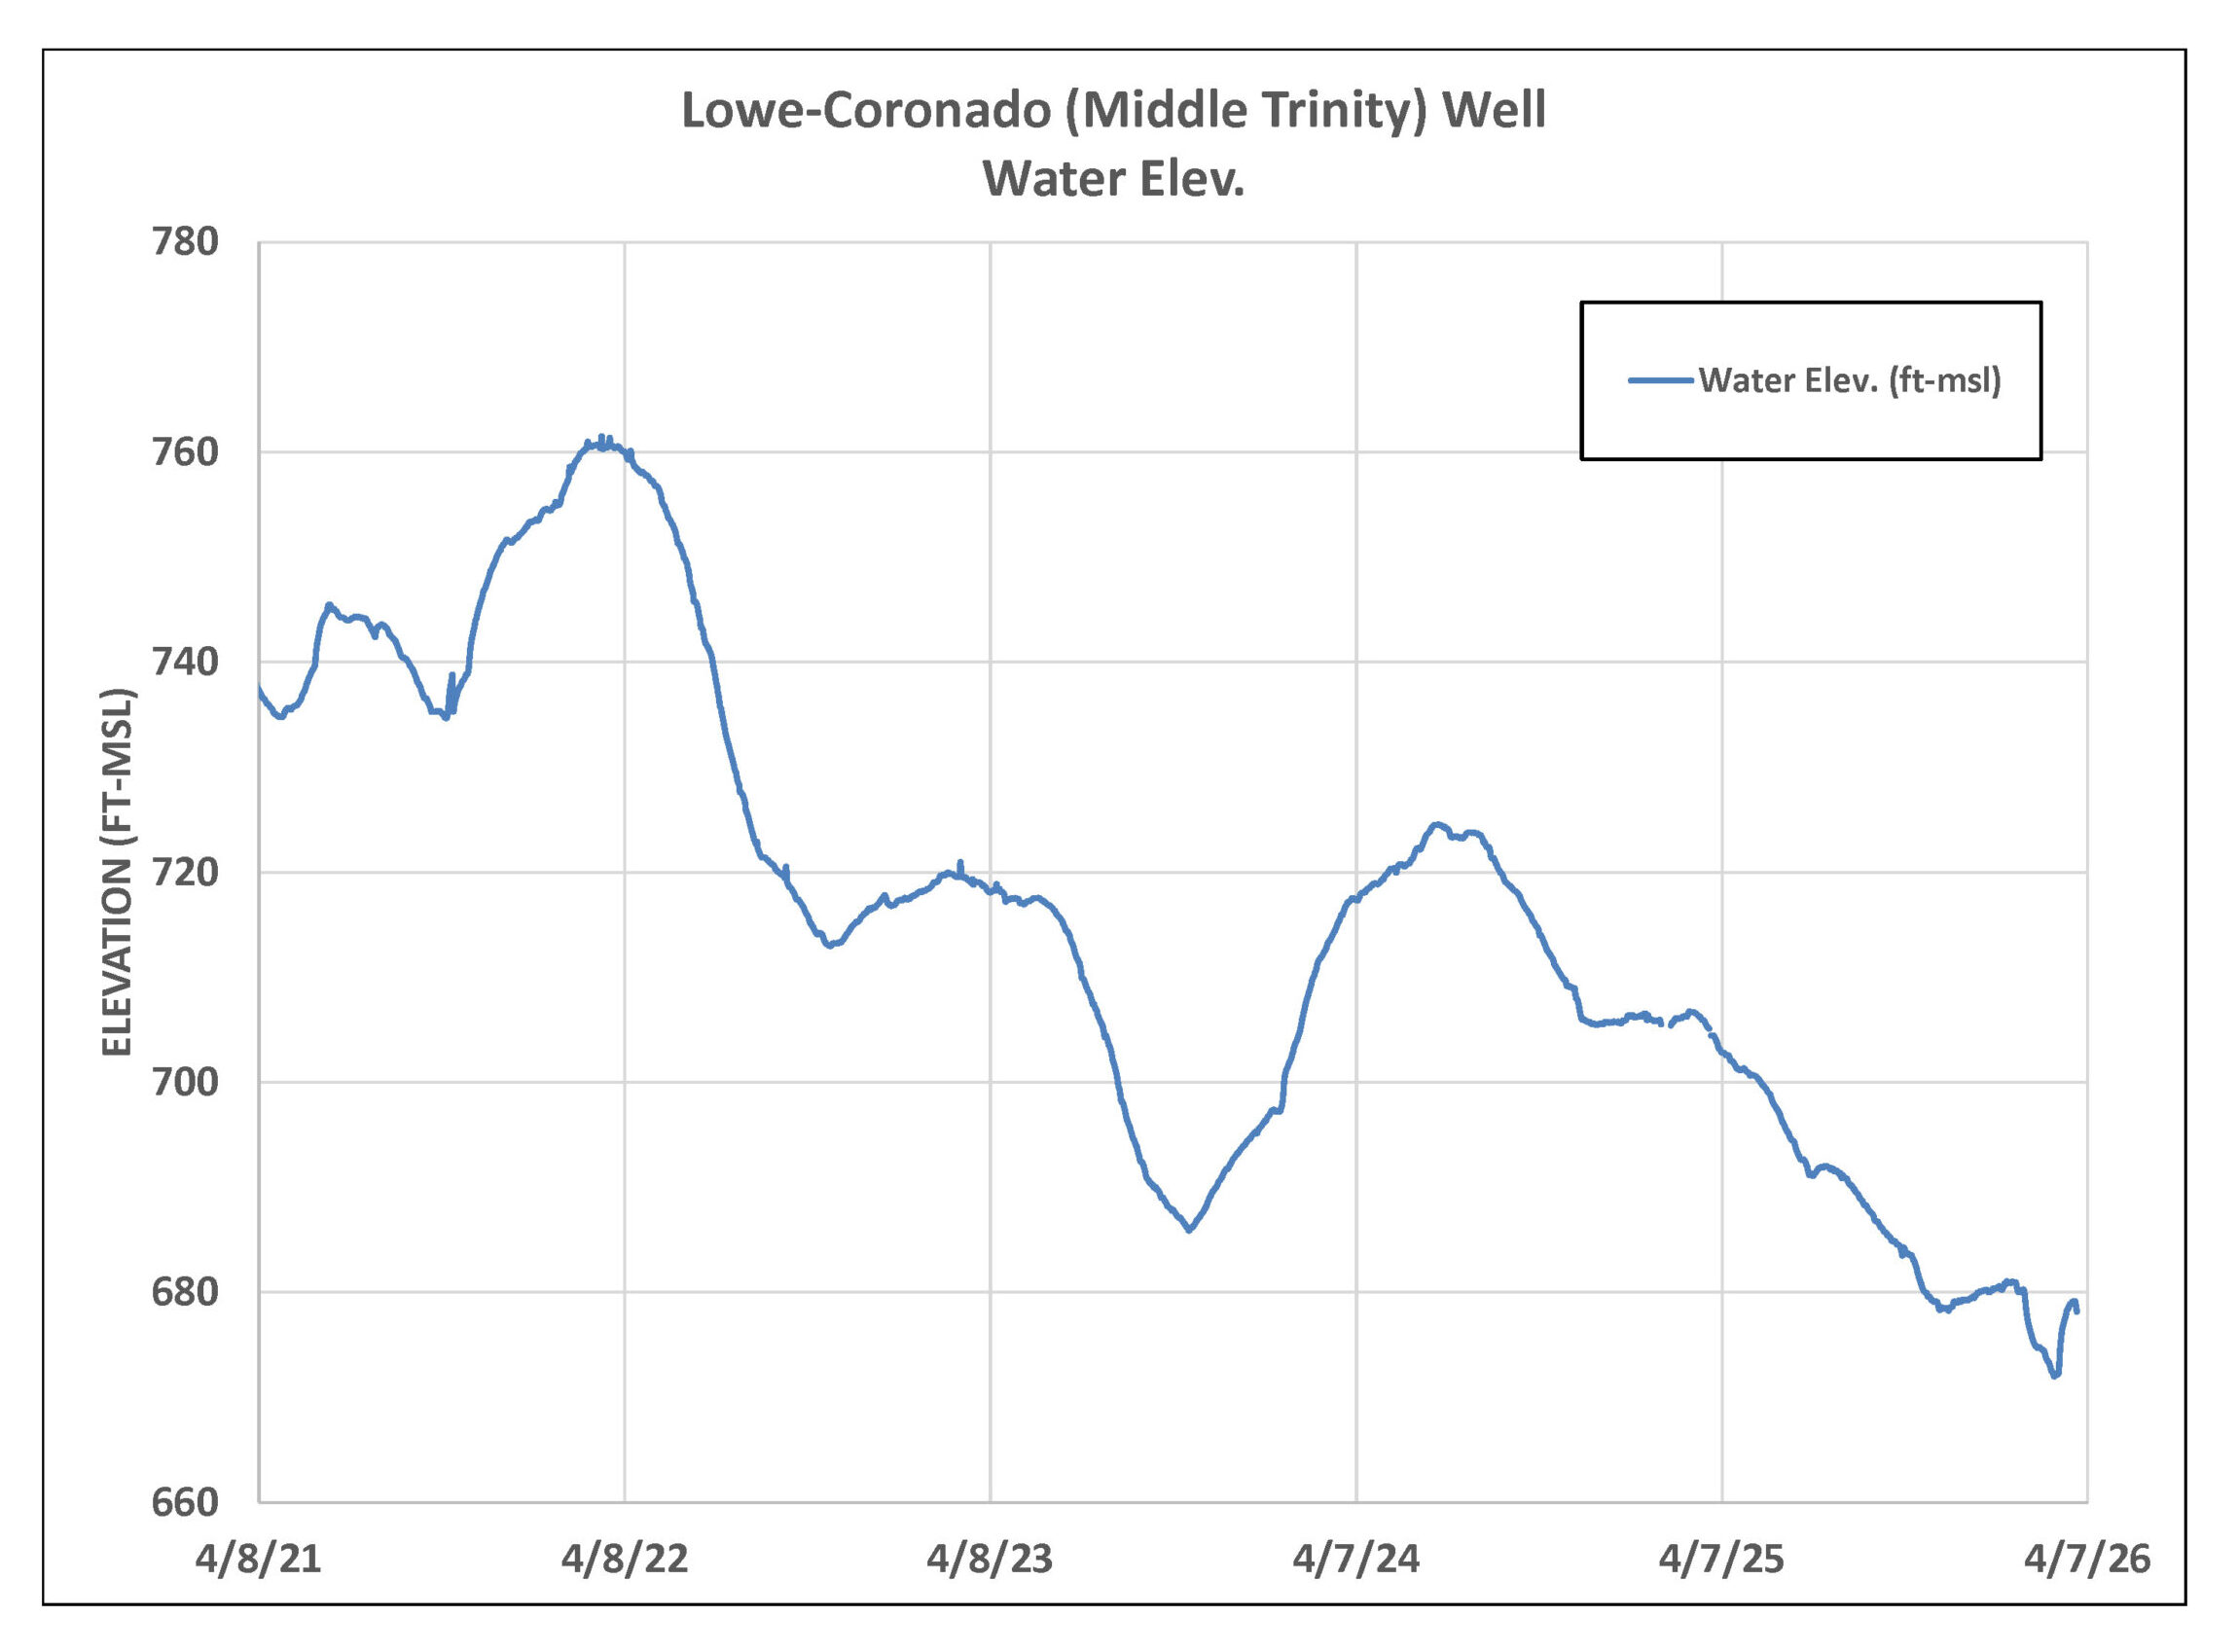
Figure 6. Lowe-Coronado (Middle Trinity) monitor well water-level elevation.
Outlook
The Climate Prediction Center’s forecast for April-May-June shows average temperatures in most of the US. Central Texas has equal chances of above or below average rainfall during that timeframe.
Figure 7. April-May-June 2026 Seasonal Precipitation Outlook for the US according to the climate Prediction Center.