
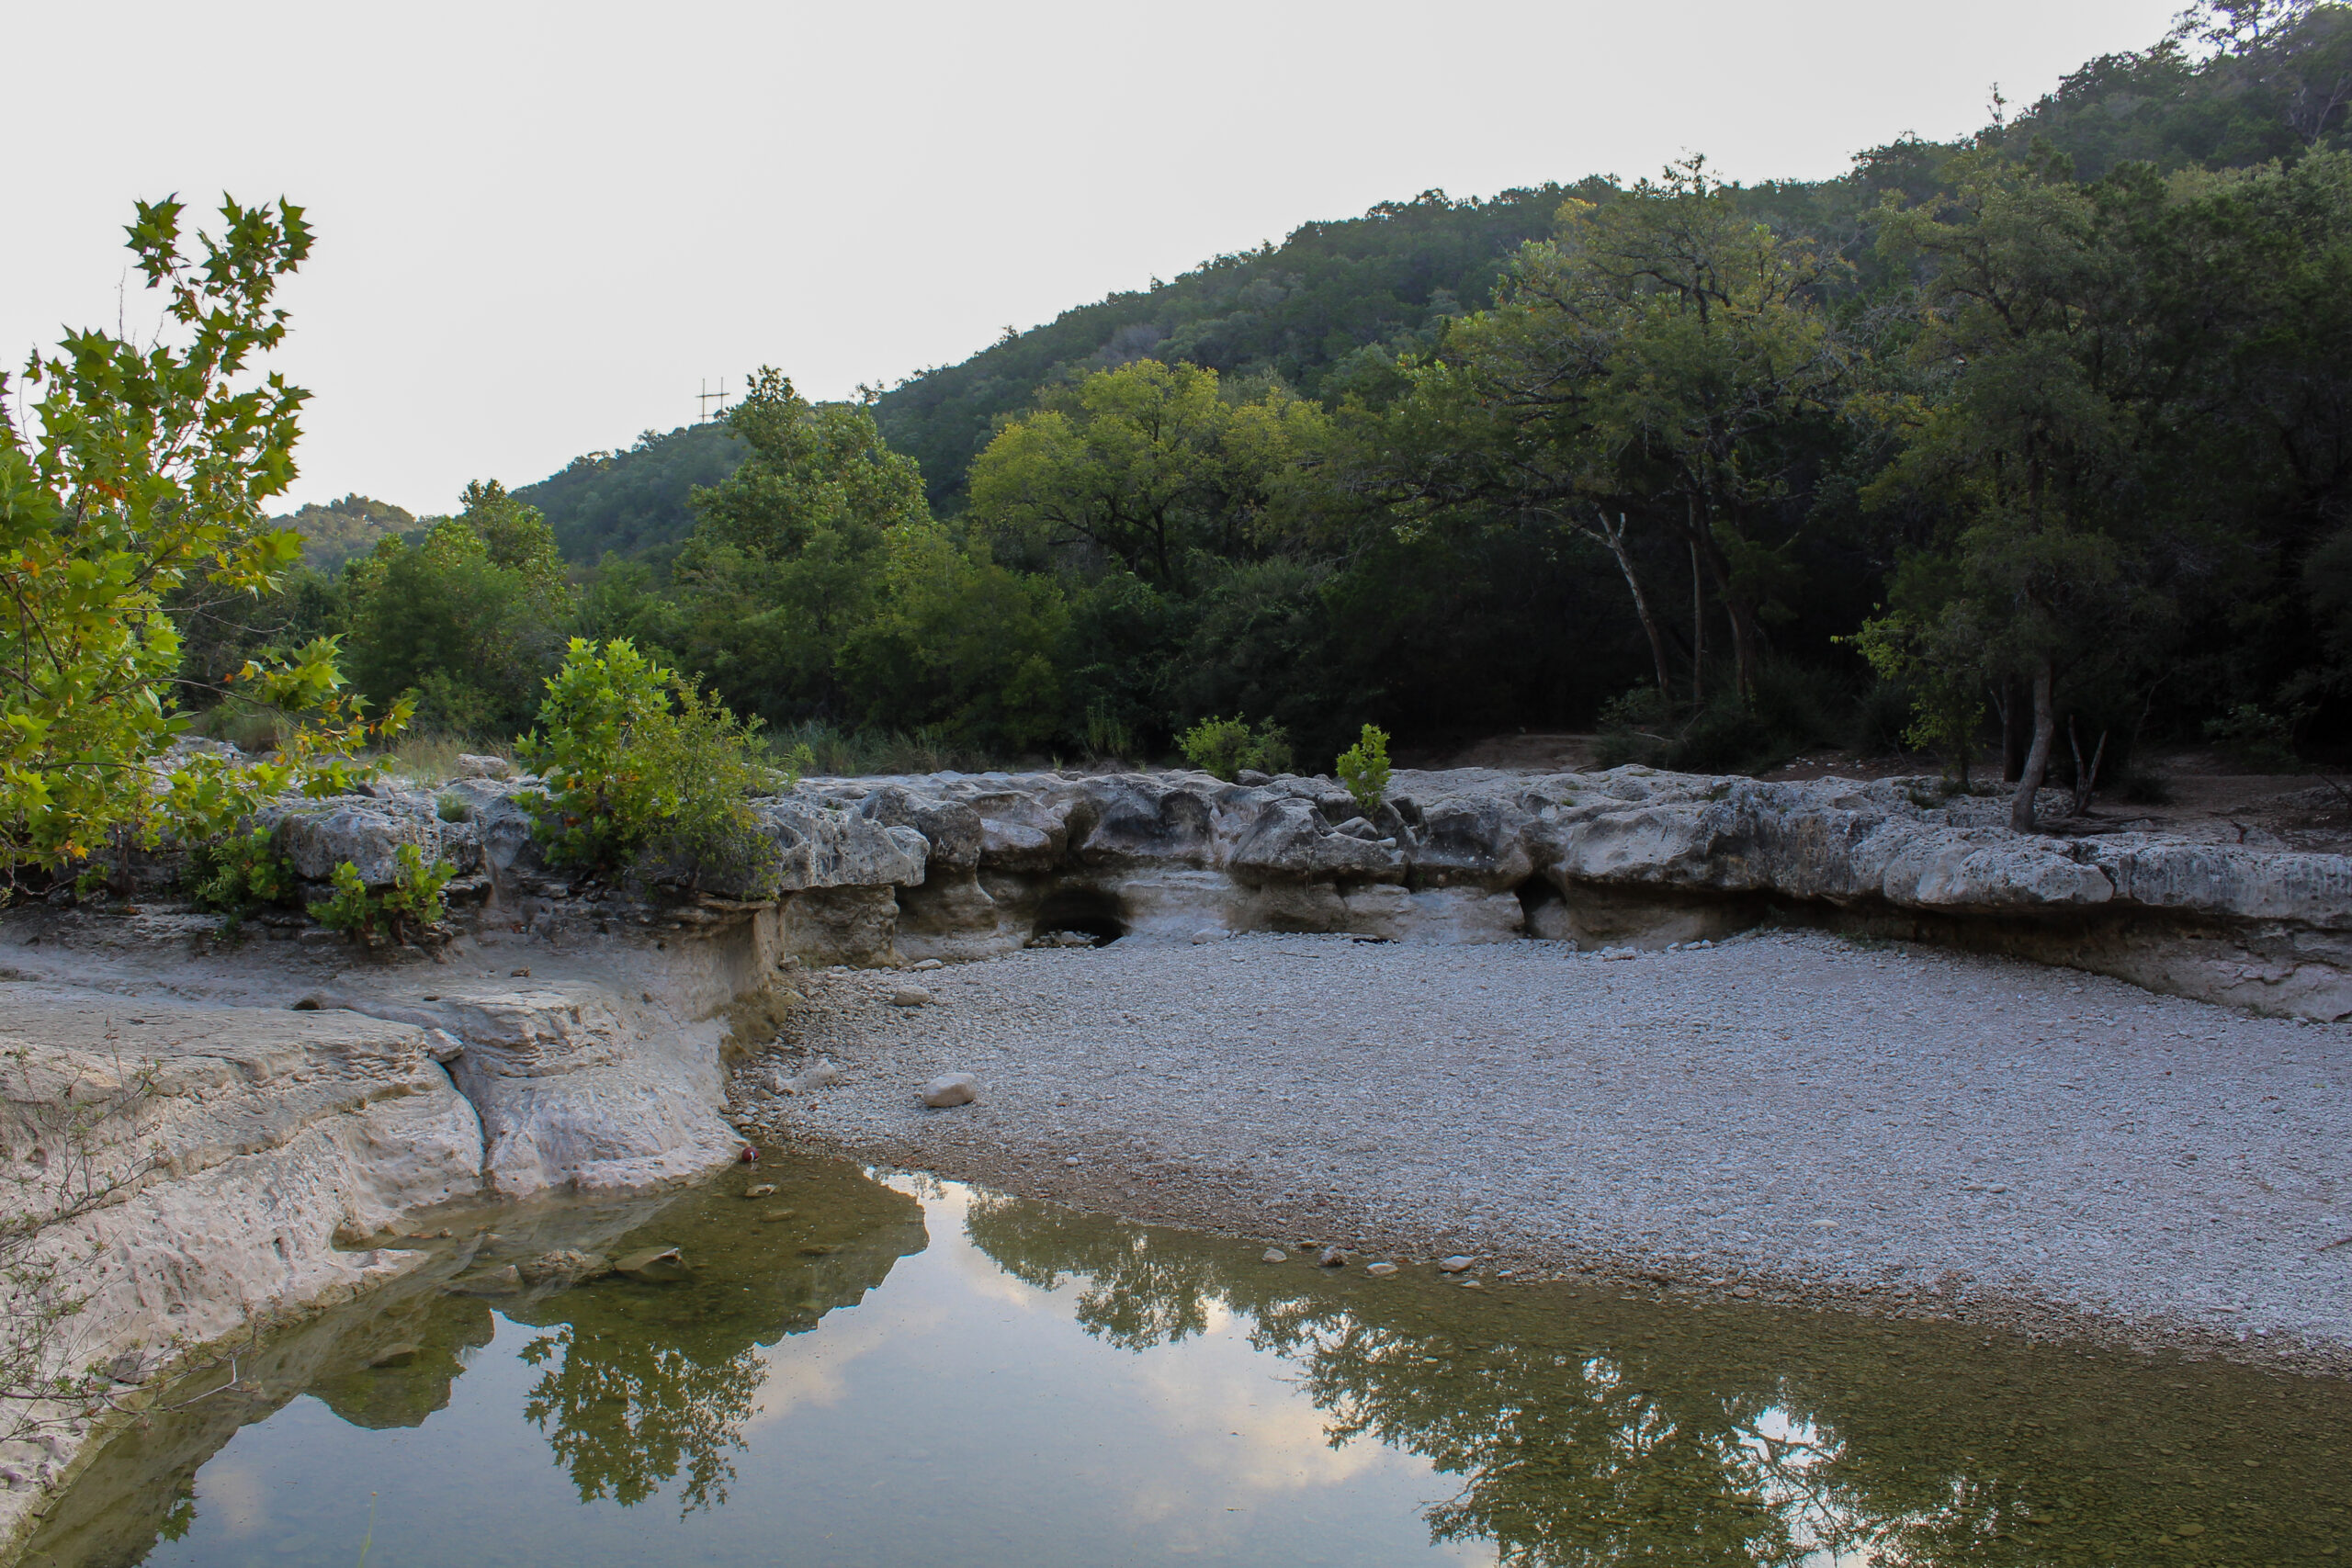
Photo of Sculpture Falls taken on August 3, 2026.
District’s Current Drought Status: Stage 3 Exceptional Drought
July brought the first triple-digit temperatures of the year to Austin-Bergstrom International Airport (ABIA) and Camp Mabry, though fortunately there were only five days with highs at or above 100°F. July also marked the fourth consecutive month of above-average rainfall, providing continued recharge to both the Edwards and Trinity Aquifers.
While these rainy conditions have improved aquifer conditions, they have not delivered the drought-ending rainfall the region needs. The modest gains of the past few months could quickly diminish as hot, dry weather persists. The Board of Directors will review current conditions and consider the District’s drought status at its August 13 meeting.
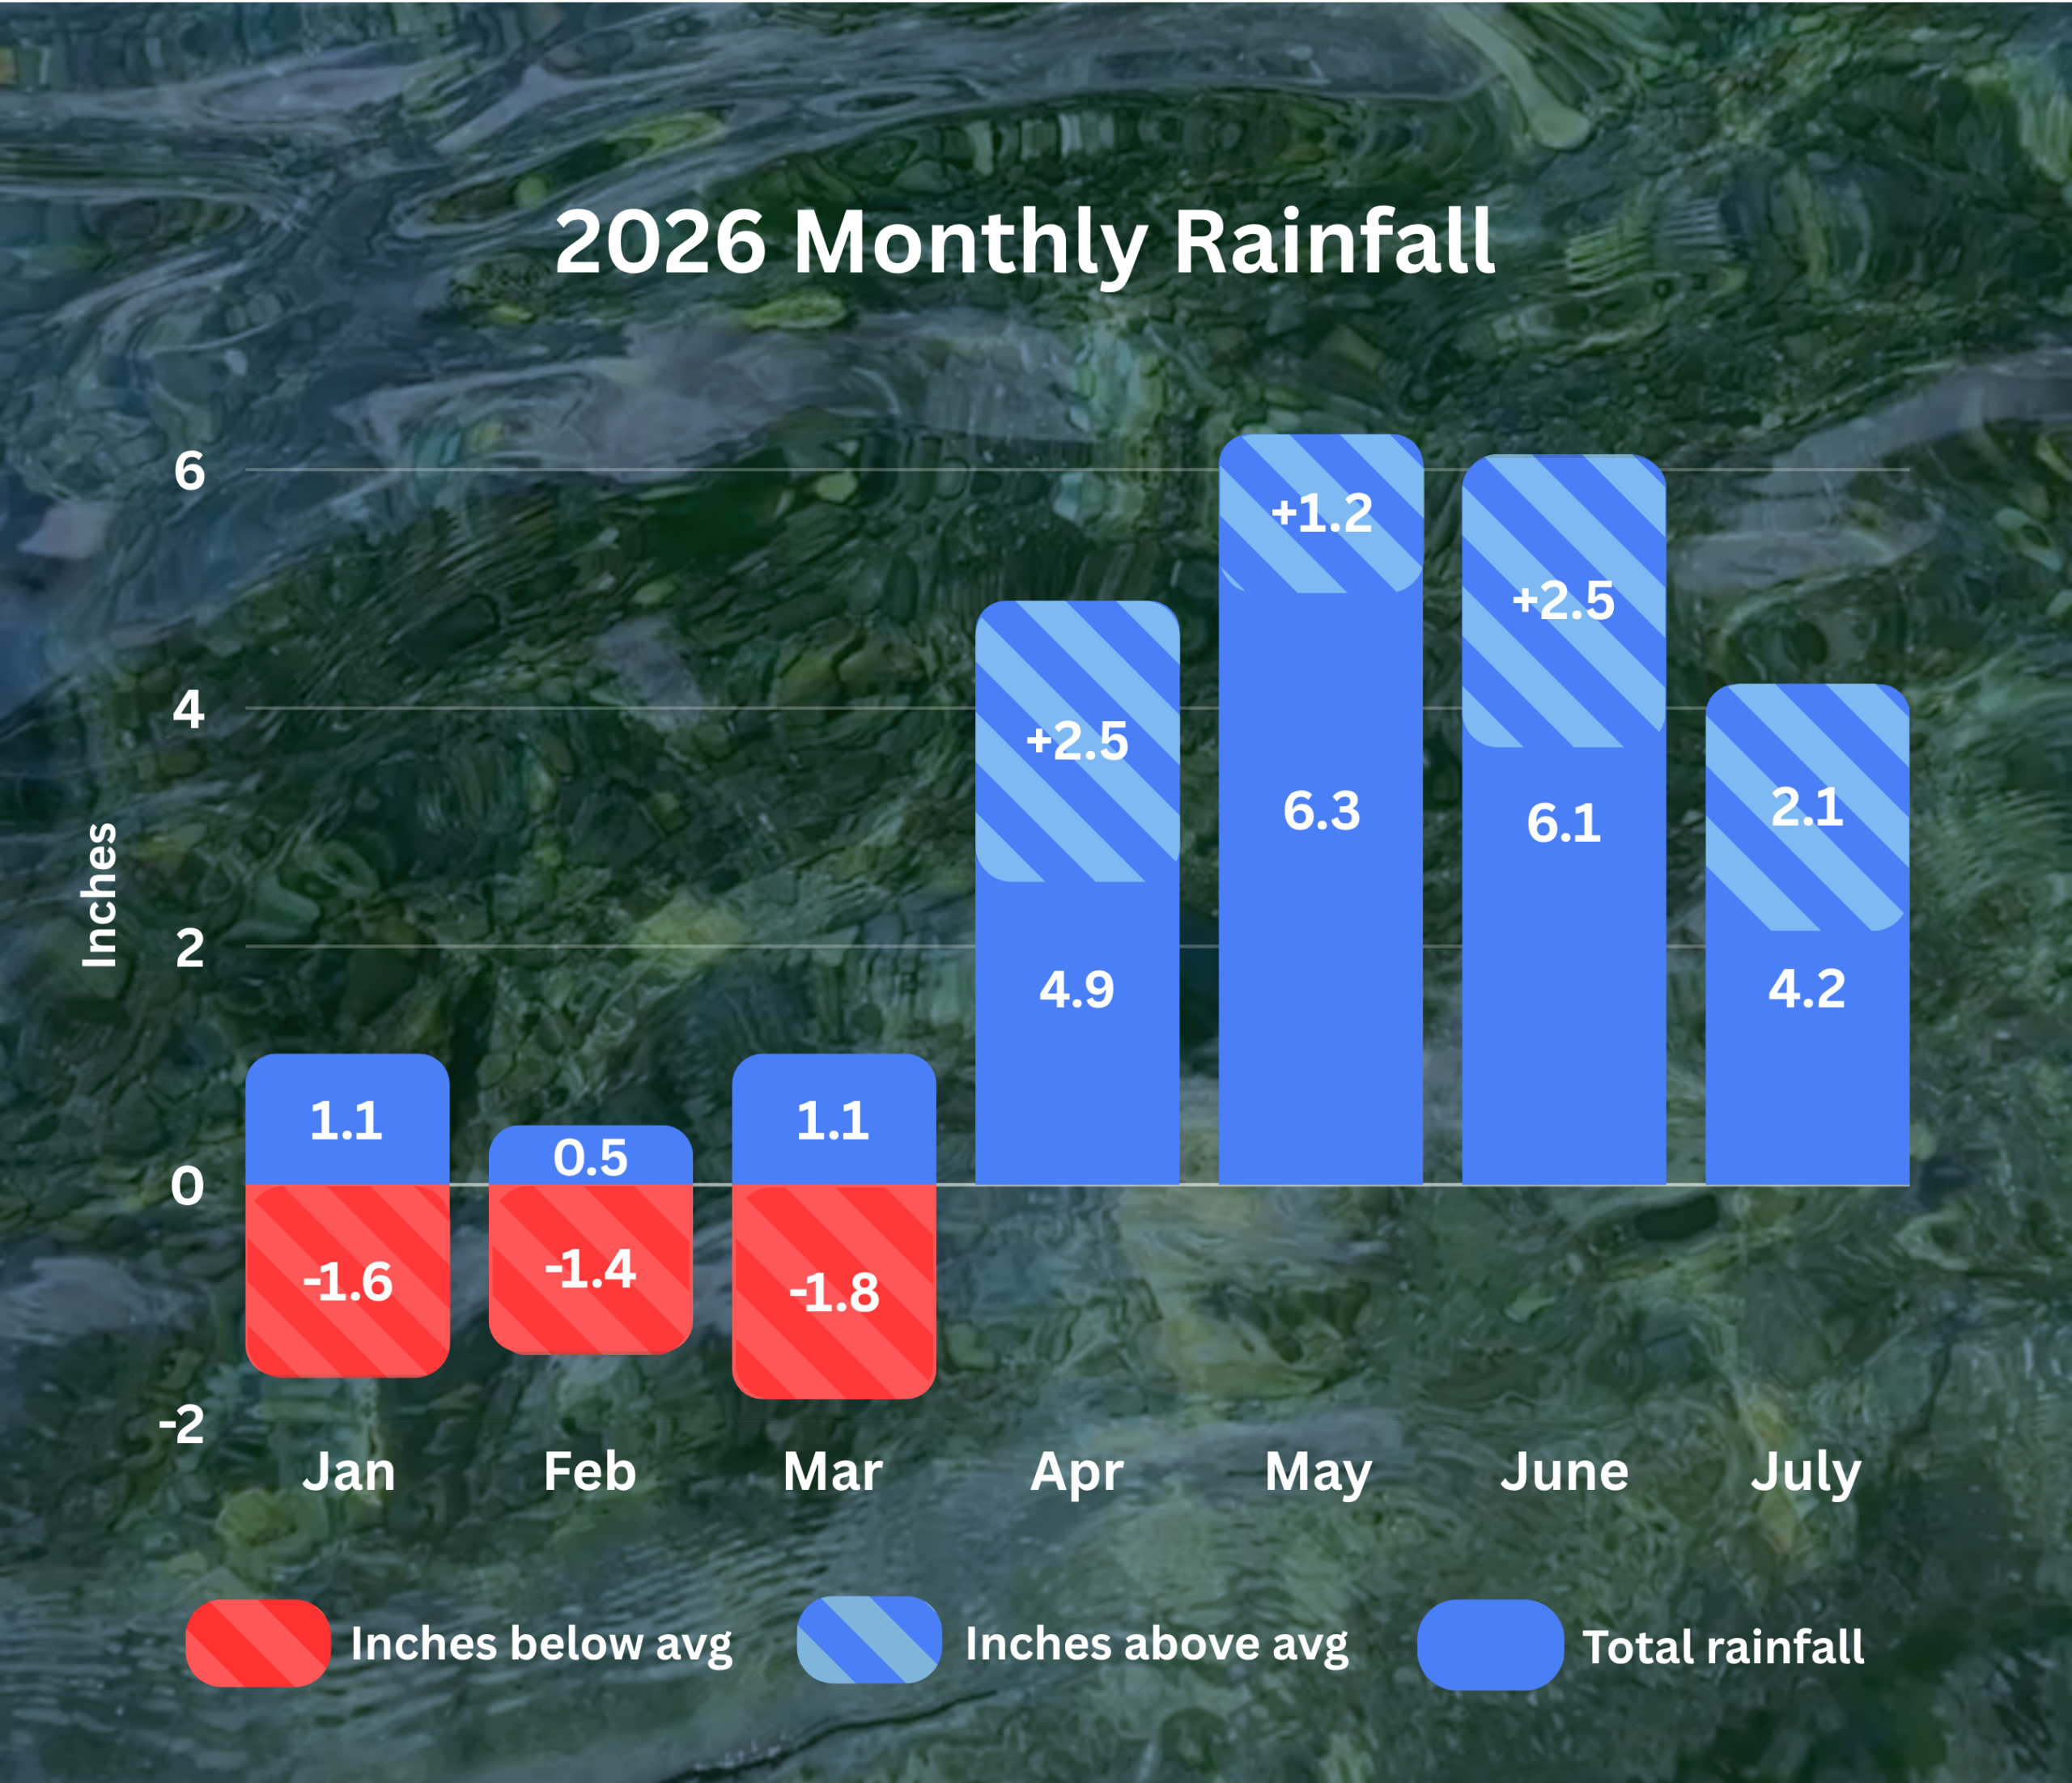
Figure 1. Monthly deviation from average and monthly total rainfall in District’s territory for 2026.
Rainfall Recap
Total July rainfall averaged approximately 3.5 inches across the Camp Mabry and ABIA weather stations – about 1.5 inches above the long-term monthly average (Figure 1 and Figure 2). January through the end of July 2026, Central Texas received 23.4 inches of rainfall, or about 65% of its historical annual average of 36 inches.
This above-average rainfall is especially encouraging because July is typically the second-driest month of the year in Central Texas, averaging only about 2.0 inches of rain. Combined with wetter-than-normal conditions in May and June, the widespread 3 to 4 inches of rain that fell between July 11 and July 16 generated enough flow across the recharge zone to provide additional recharge to both the Edwards and Trinity Aquifers.
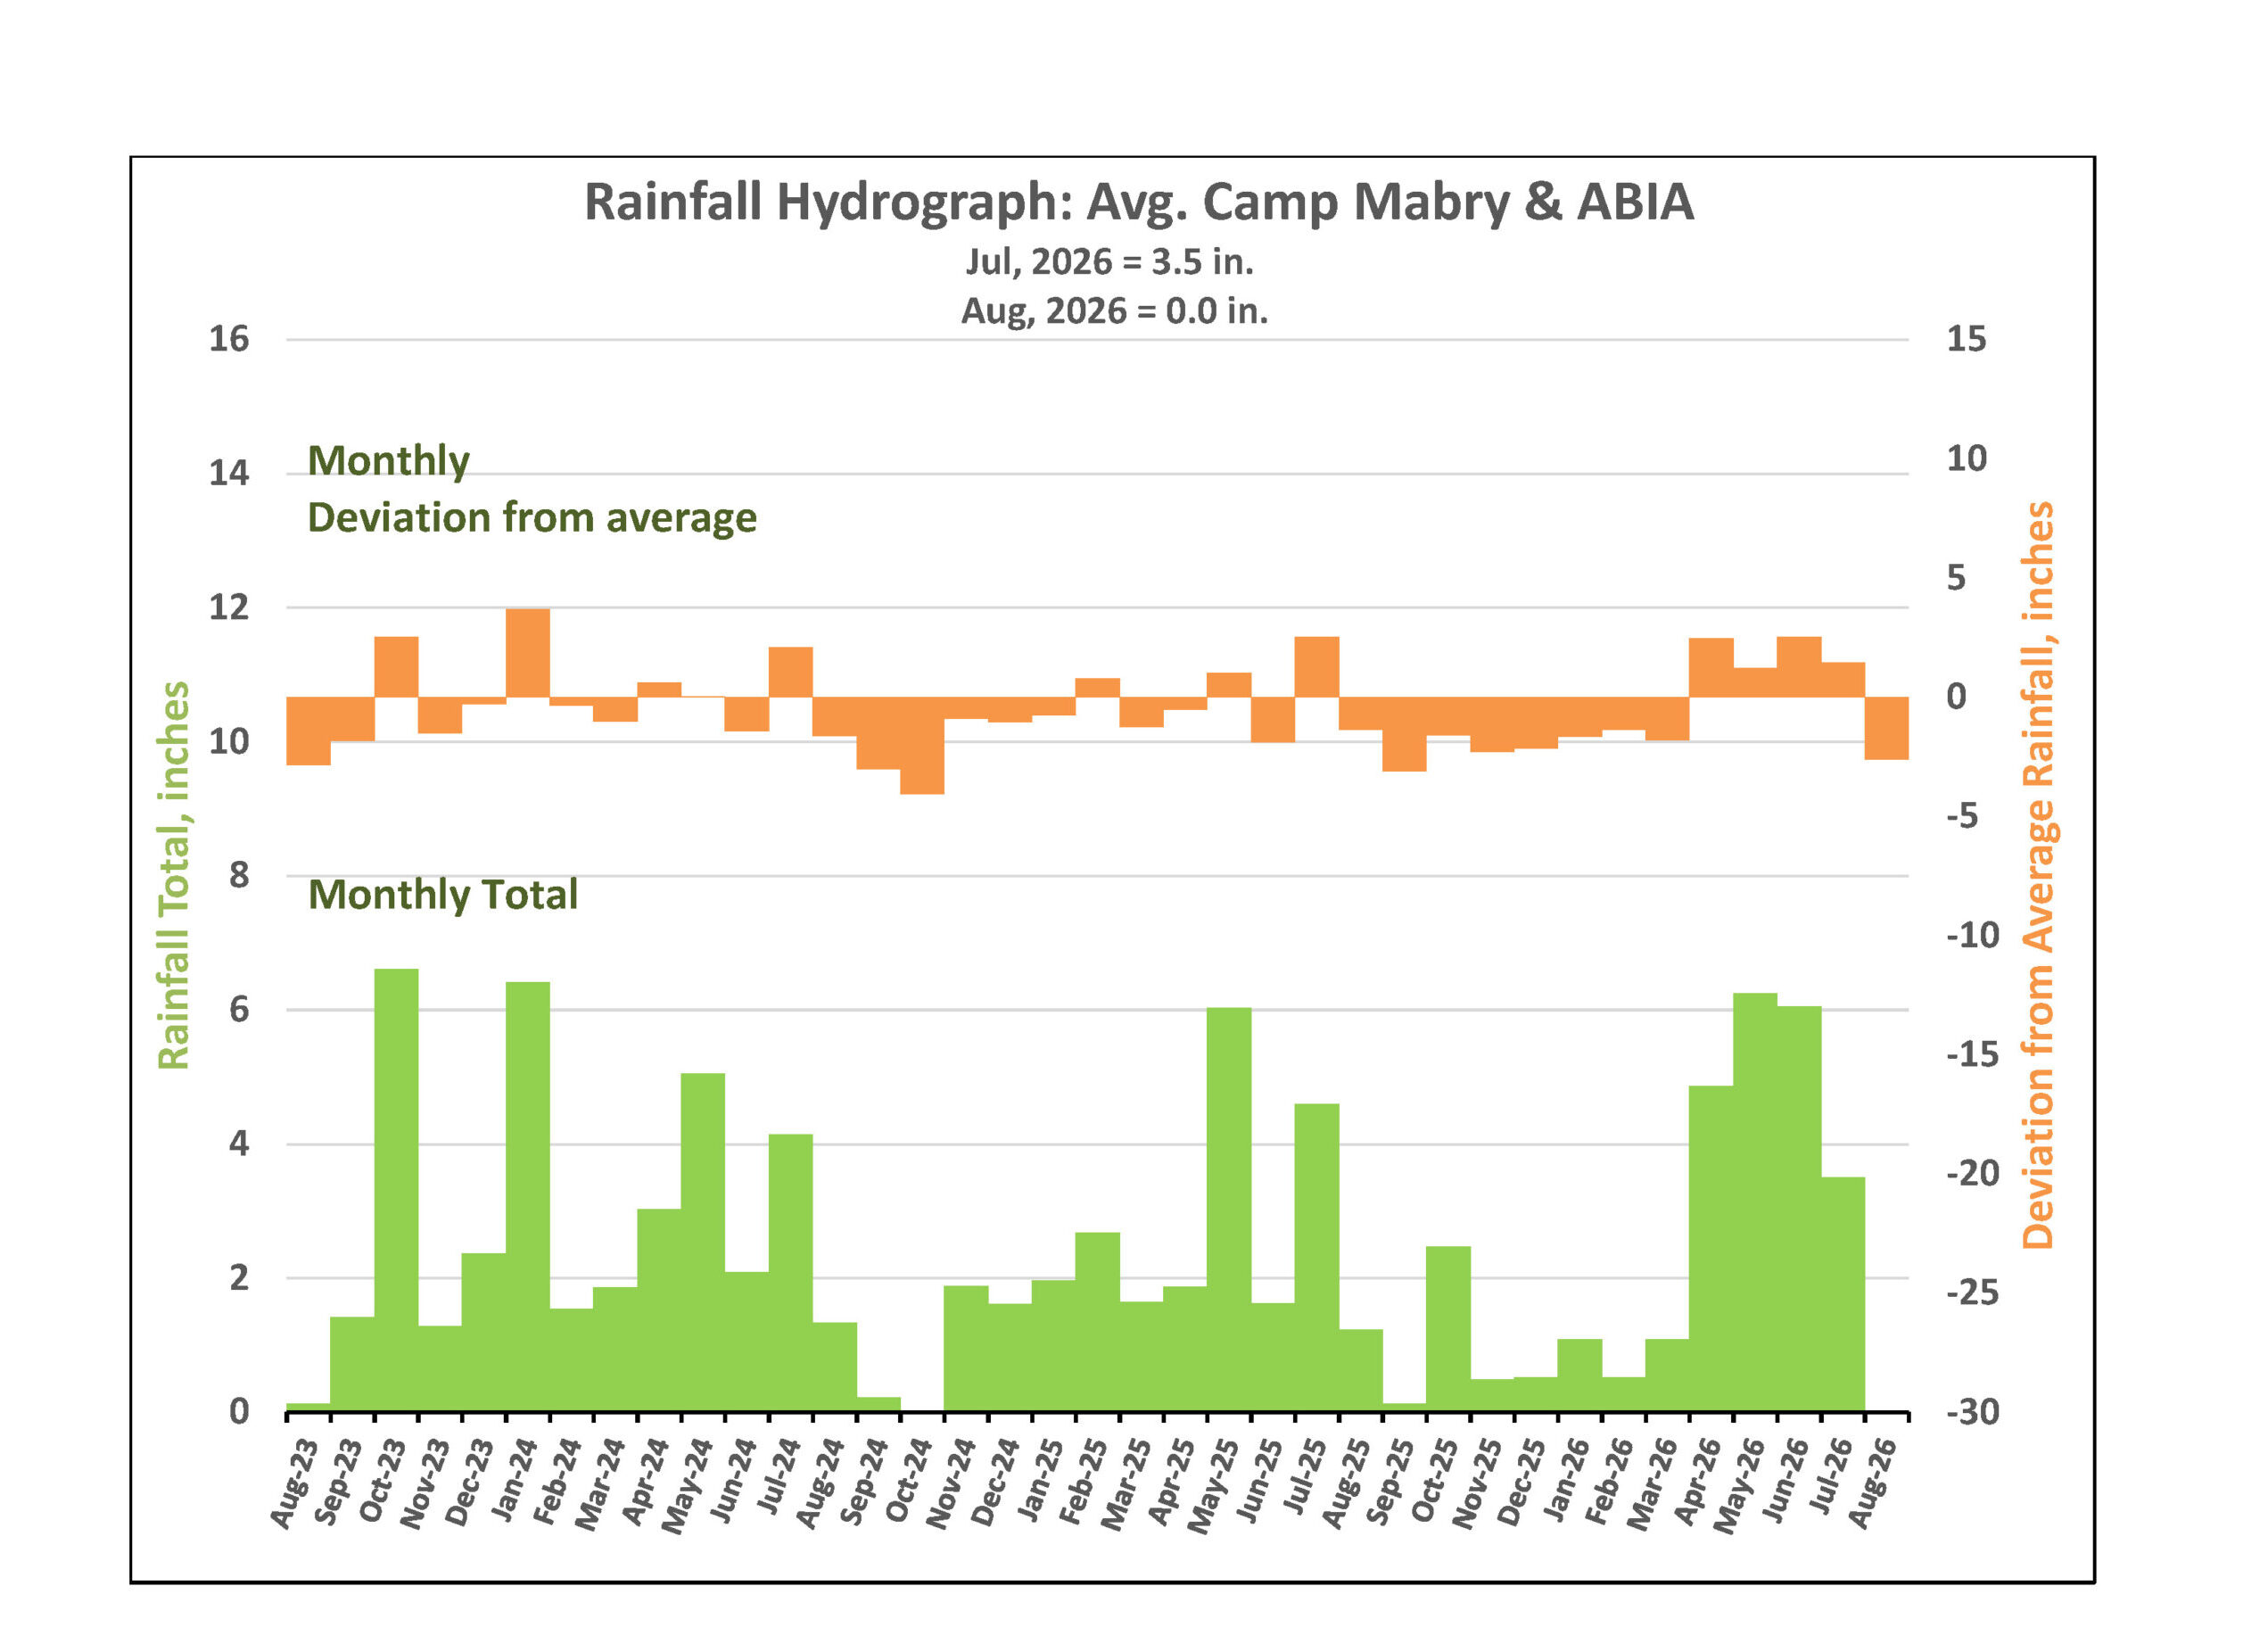
Figure 2. Monthly deviation from average and monthly total rainfall in District’s territory.
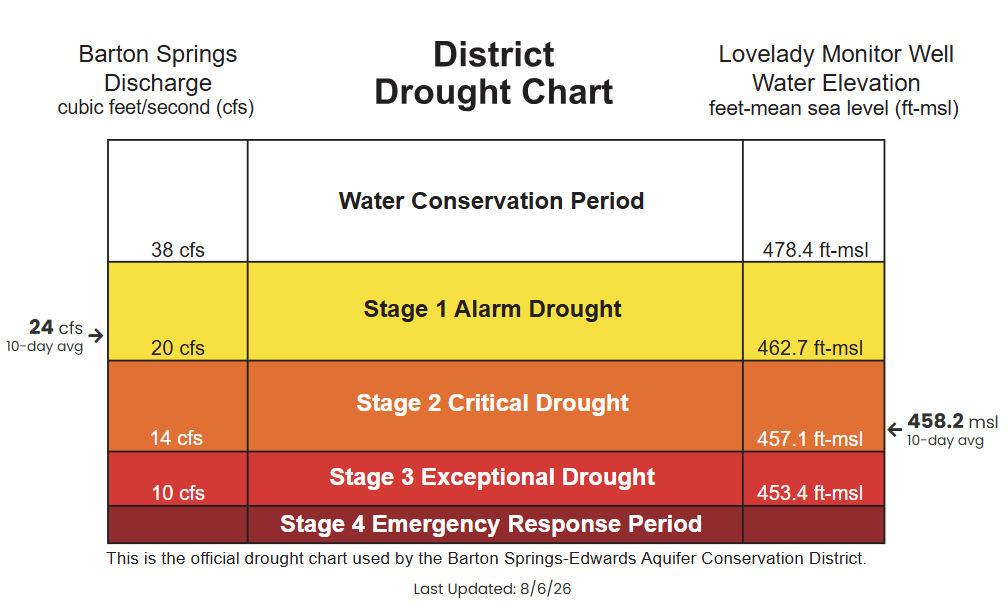
Figure 3. District Drought Chart as of 8/6/2026 displaying 10-day averages for springflow at Barton Springs (left) and groundwater levels at Lovelady monitor well (right)—both of which play a role in determining the District’s drought stage.
Barton Springs Flow
As of August 6, the 10-day average discharge at Barton Springs is 24 cubic feet per second (cfs). The widespread 3 to 4 inches of rainfall in mid-July produced another, though smaller, increase in spring flow, helping to temporarily slow the typical summer decline (Figure 4).
Although Barton Springs flow remains above the 20 cfs threshold for Stage 1 Alarm drought conditions, these recent gains are diminishing. When considering whether to declare a new drought stage, the Board of Directors will evaluate current aquifer conditions along with factors such as rainfall forecasts and seasonal trends. Without additional rainfall, Barton Springs flow could decline to Stage 3 drought levels as early as October.
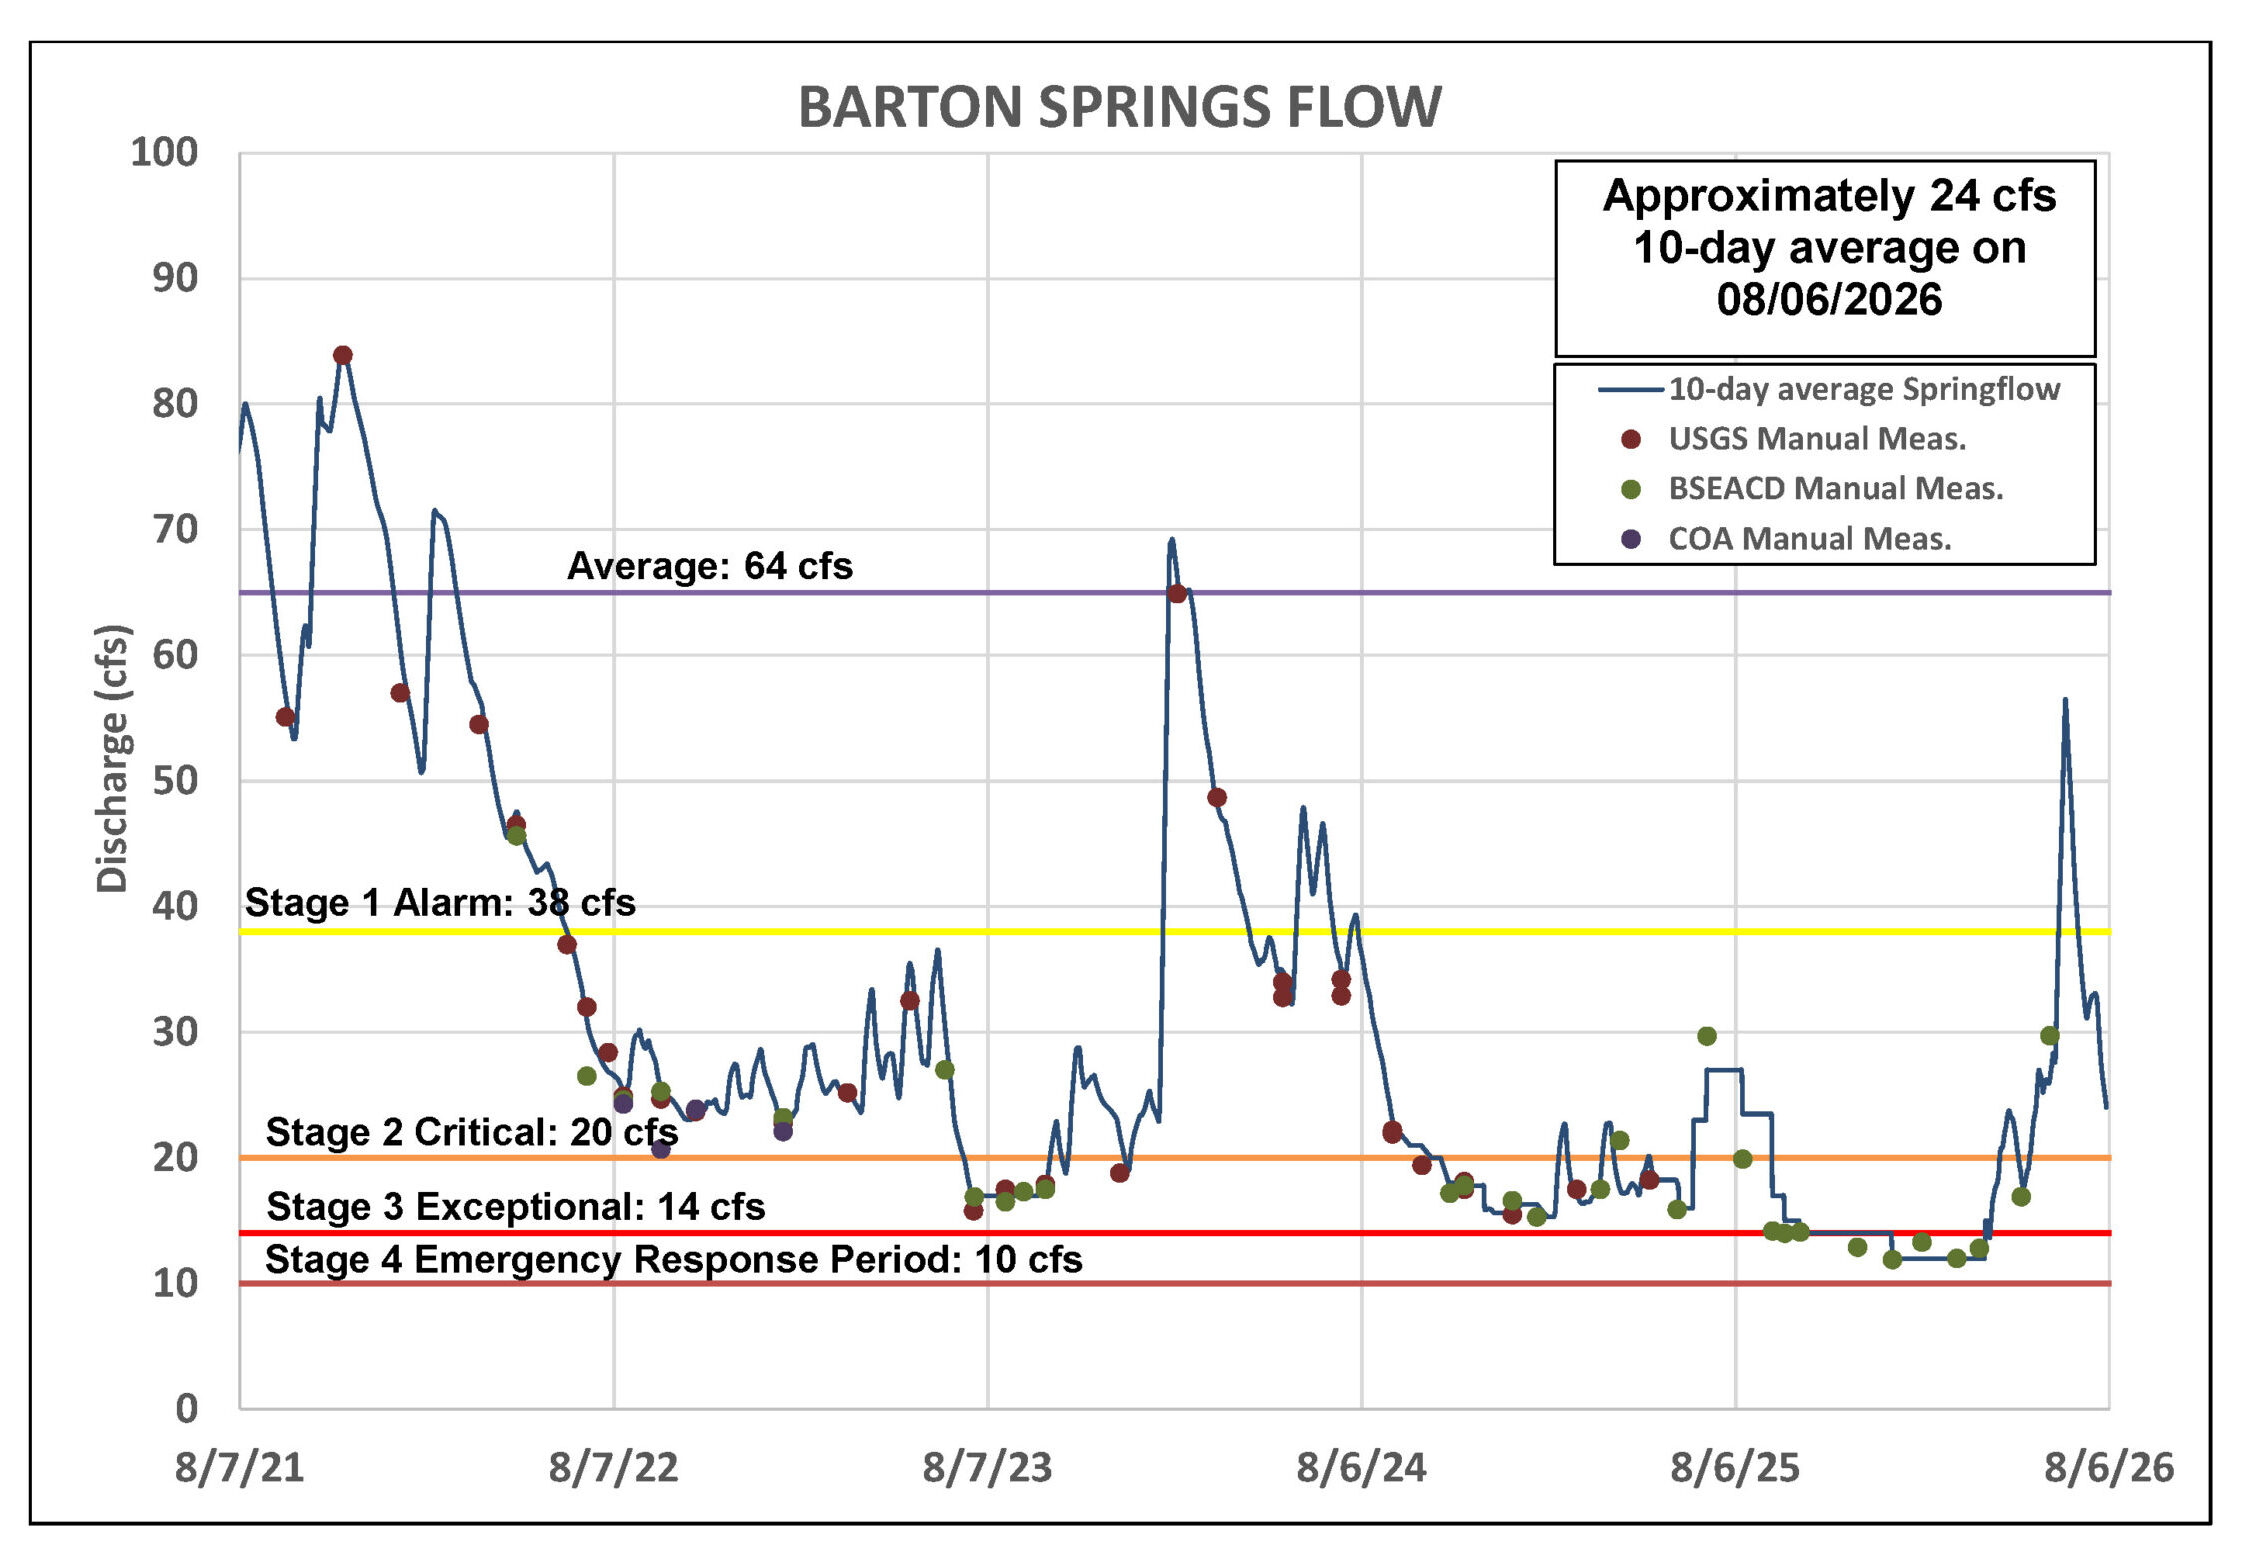
Figure 4. Barton Springs flow for the last five years.
*Note: Recent data for Barton Springs looks blockier than earlier, smoother records because it’s based on the average of two recent manual measurements, rather than continuous USGS gauge data.
Lovelady Monitor Well
As of August 6, the 10-day average water level at the Lovelady Monitor Well is 458.2 feet above mean sea level (ft-msl). Since March 31, 2026, when water levels were 0.5 feet from crossing into the unprecedented Stage 4 Emergency Response Period, Lovelady has recovered by 4.3 feet. Now levels are hovering about 1 foot above the Stage 2 Critical Drought threshold, a level not seen since this time last year (Figure 5).
While these improvements are encouraging and water levels are currently within the Stage 2 Critical Drought range, the District has not yet lifted its Stage 3 Exceptional Drought declaration. To protect local drinking water wells, District staff and the Board have closely monitored groundwater levels and spring flows over the last month to determine whether these recent gains are sustained through the hottest part of the summer. Those observations will help inform whether the Board lowers the drought stage or maintains Stage 3 Exceptional Drought at its August meeting.
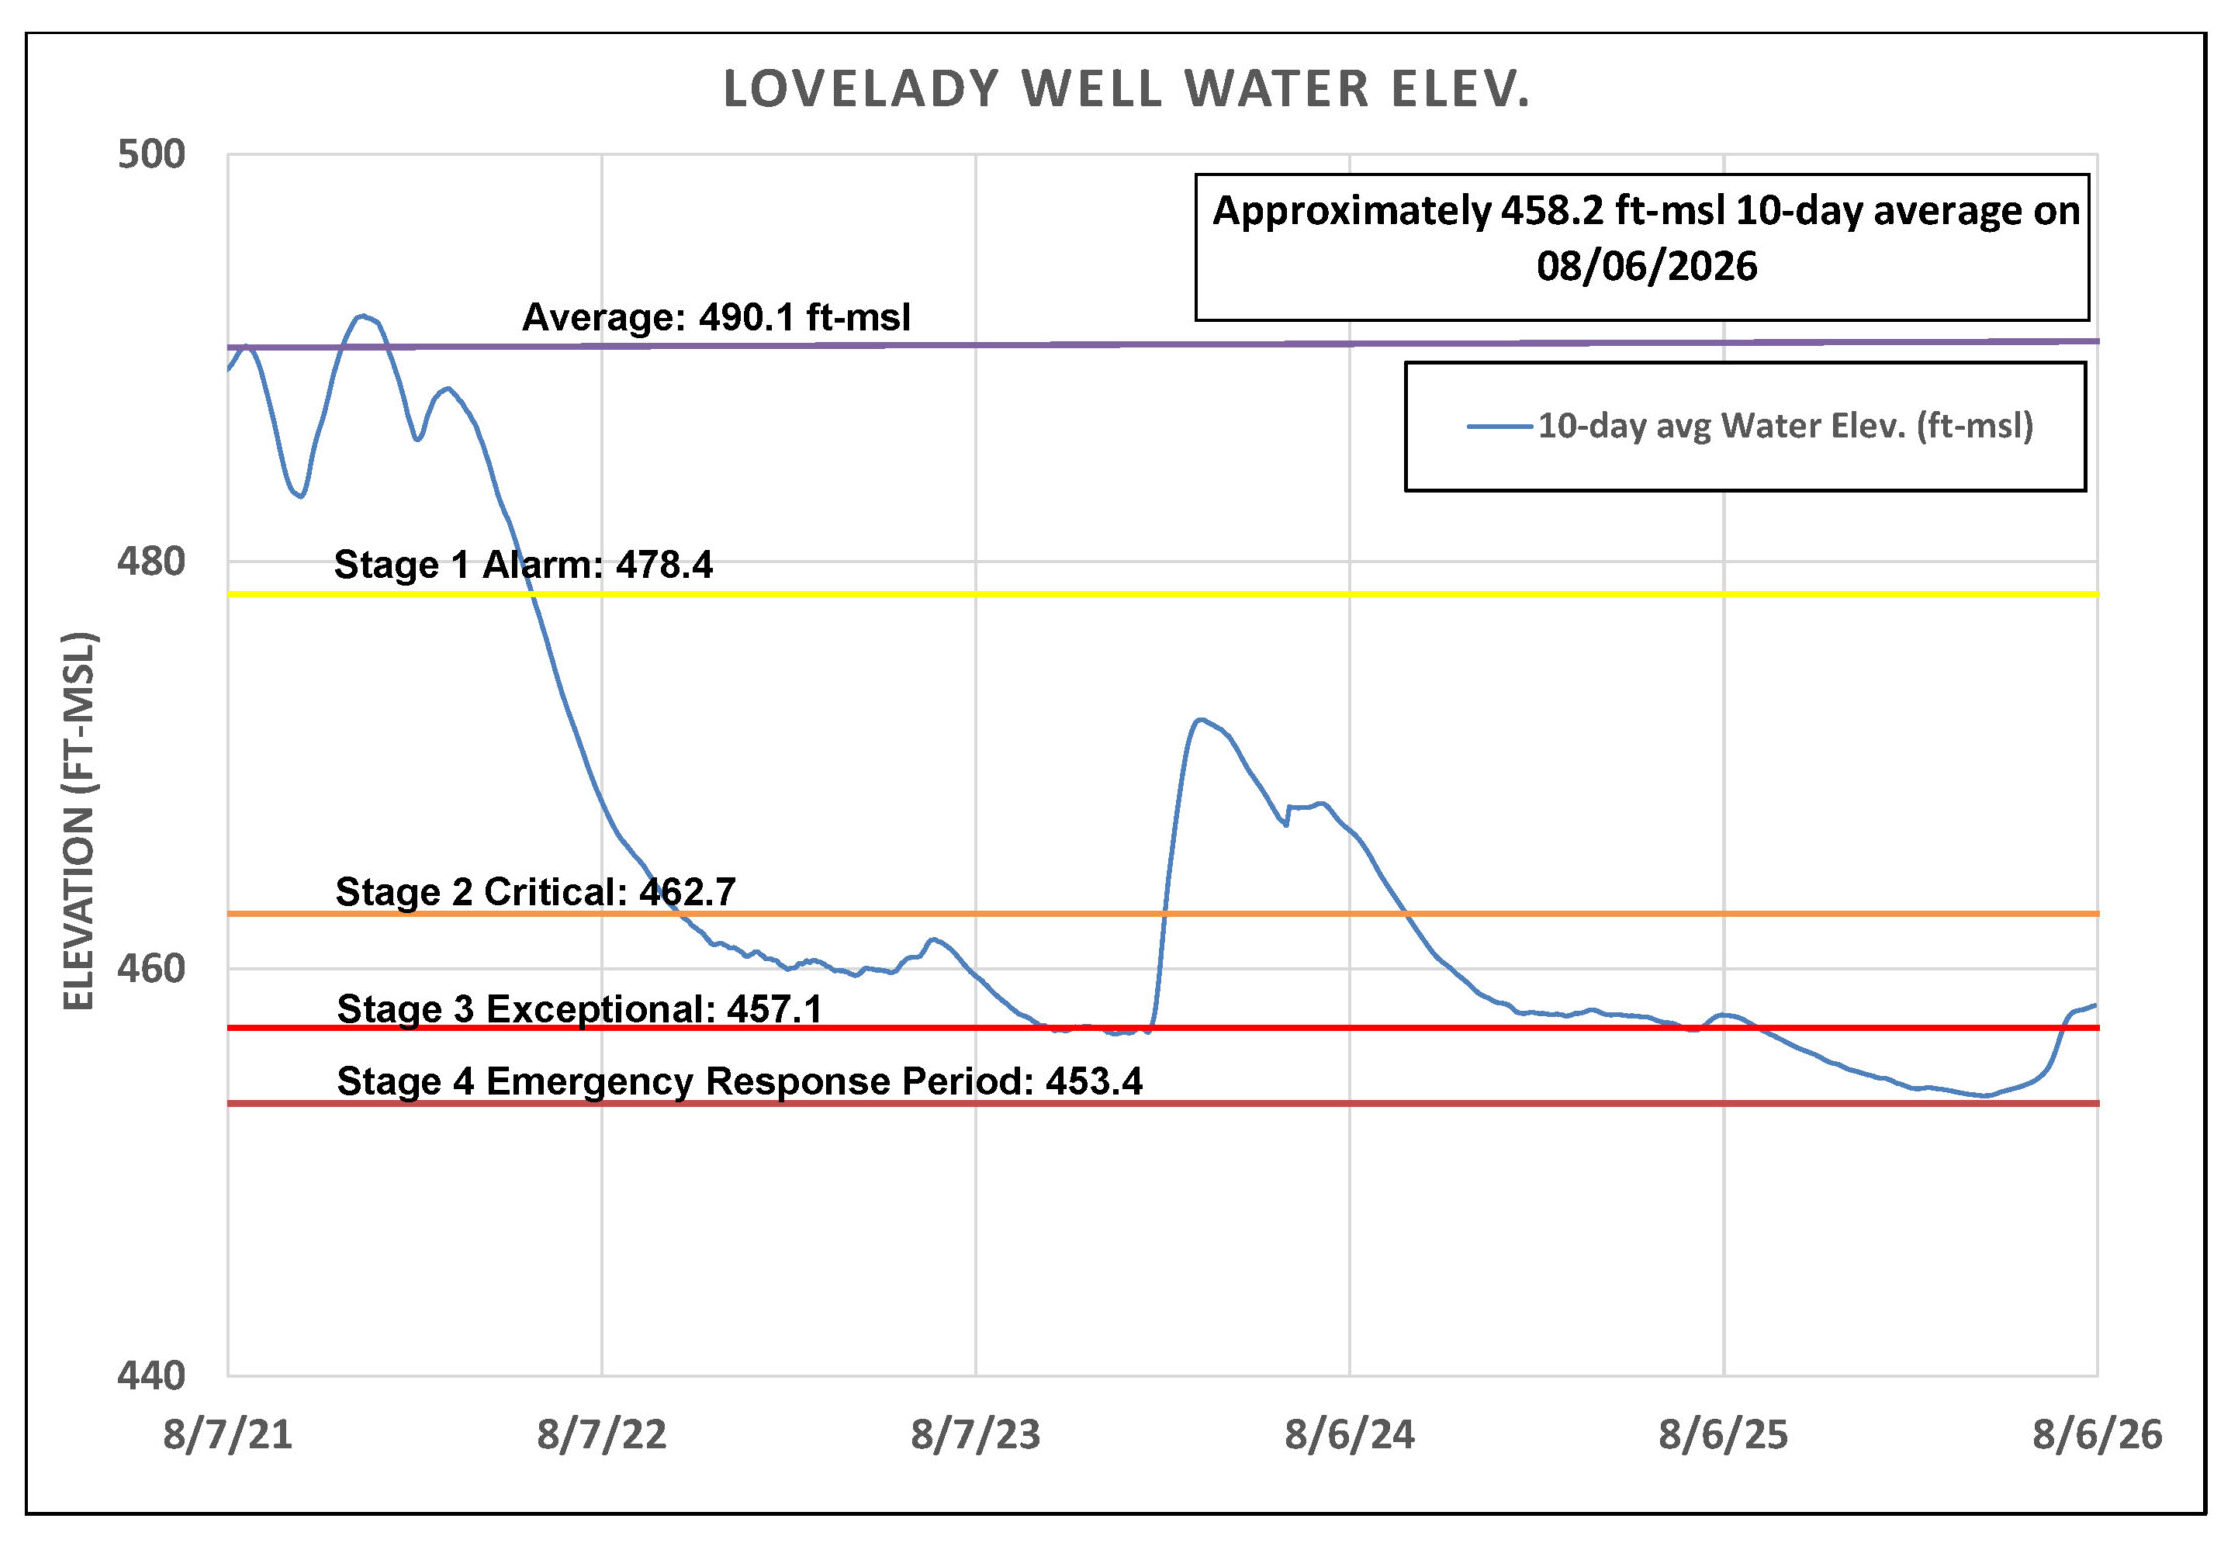
Figure 5. Lovelady groundwater level over the last five years.
Trinity Aquifer
Groundwater levels in the Trinity Aquifer have also seen gains in the last four months. The Lowe-Coronado Middle Trinity monitor well has risen approximately 4-feet since April (Figure 6), a positive trend that is also being observed – and in some areas exceeded – in portions of the Upper Trinity Aquifer.
Jacobs Well Spring also responded to July rainfall, peaking at 23 cfs on July 15 and currently maintaining a flow of just under 1 cfs. As of August 6, the spring’s 10-day average flow is 0.8 cfs.
Meanwhile, the Blanco River at Wimberley has maintained flows between 16 and 20 cfs, which are below normal. While stream flows remain relatively low, rainfall has provided modest but measurable benefits to both spring flow and river conditions within the watershed.
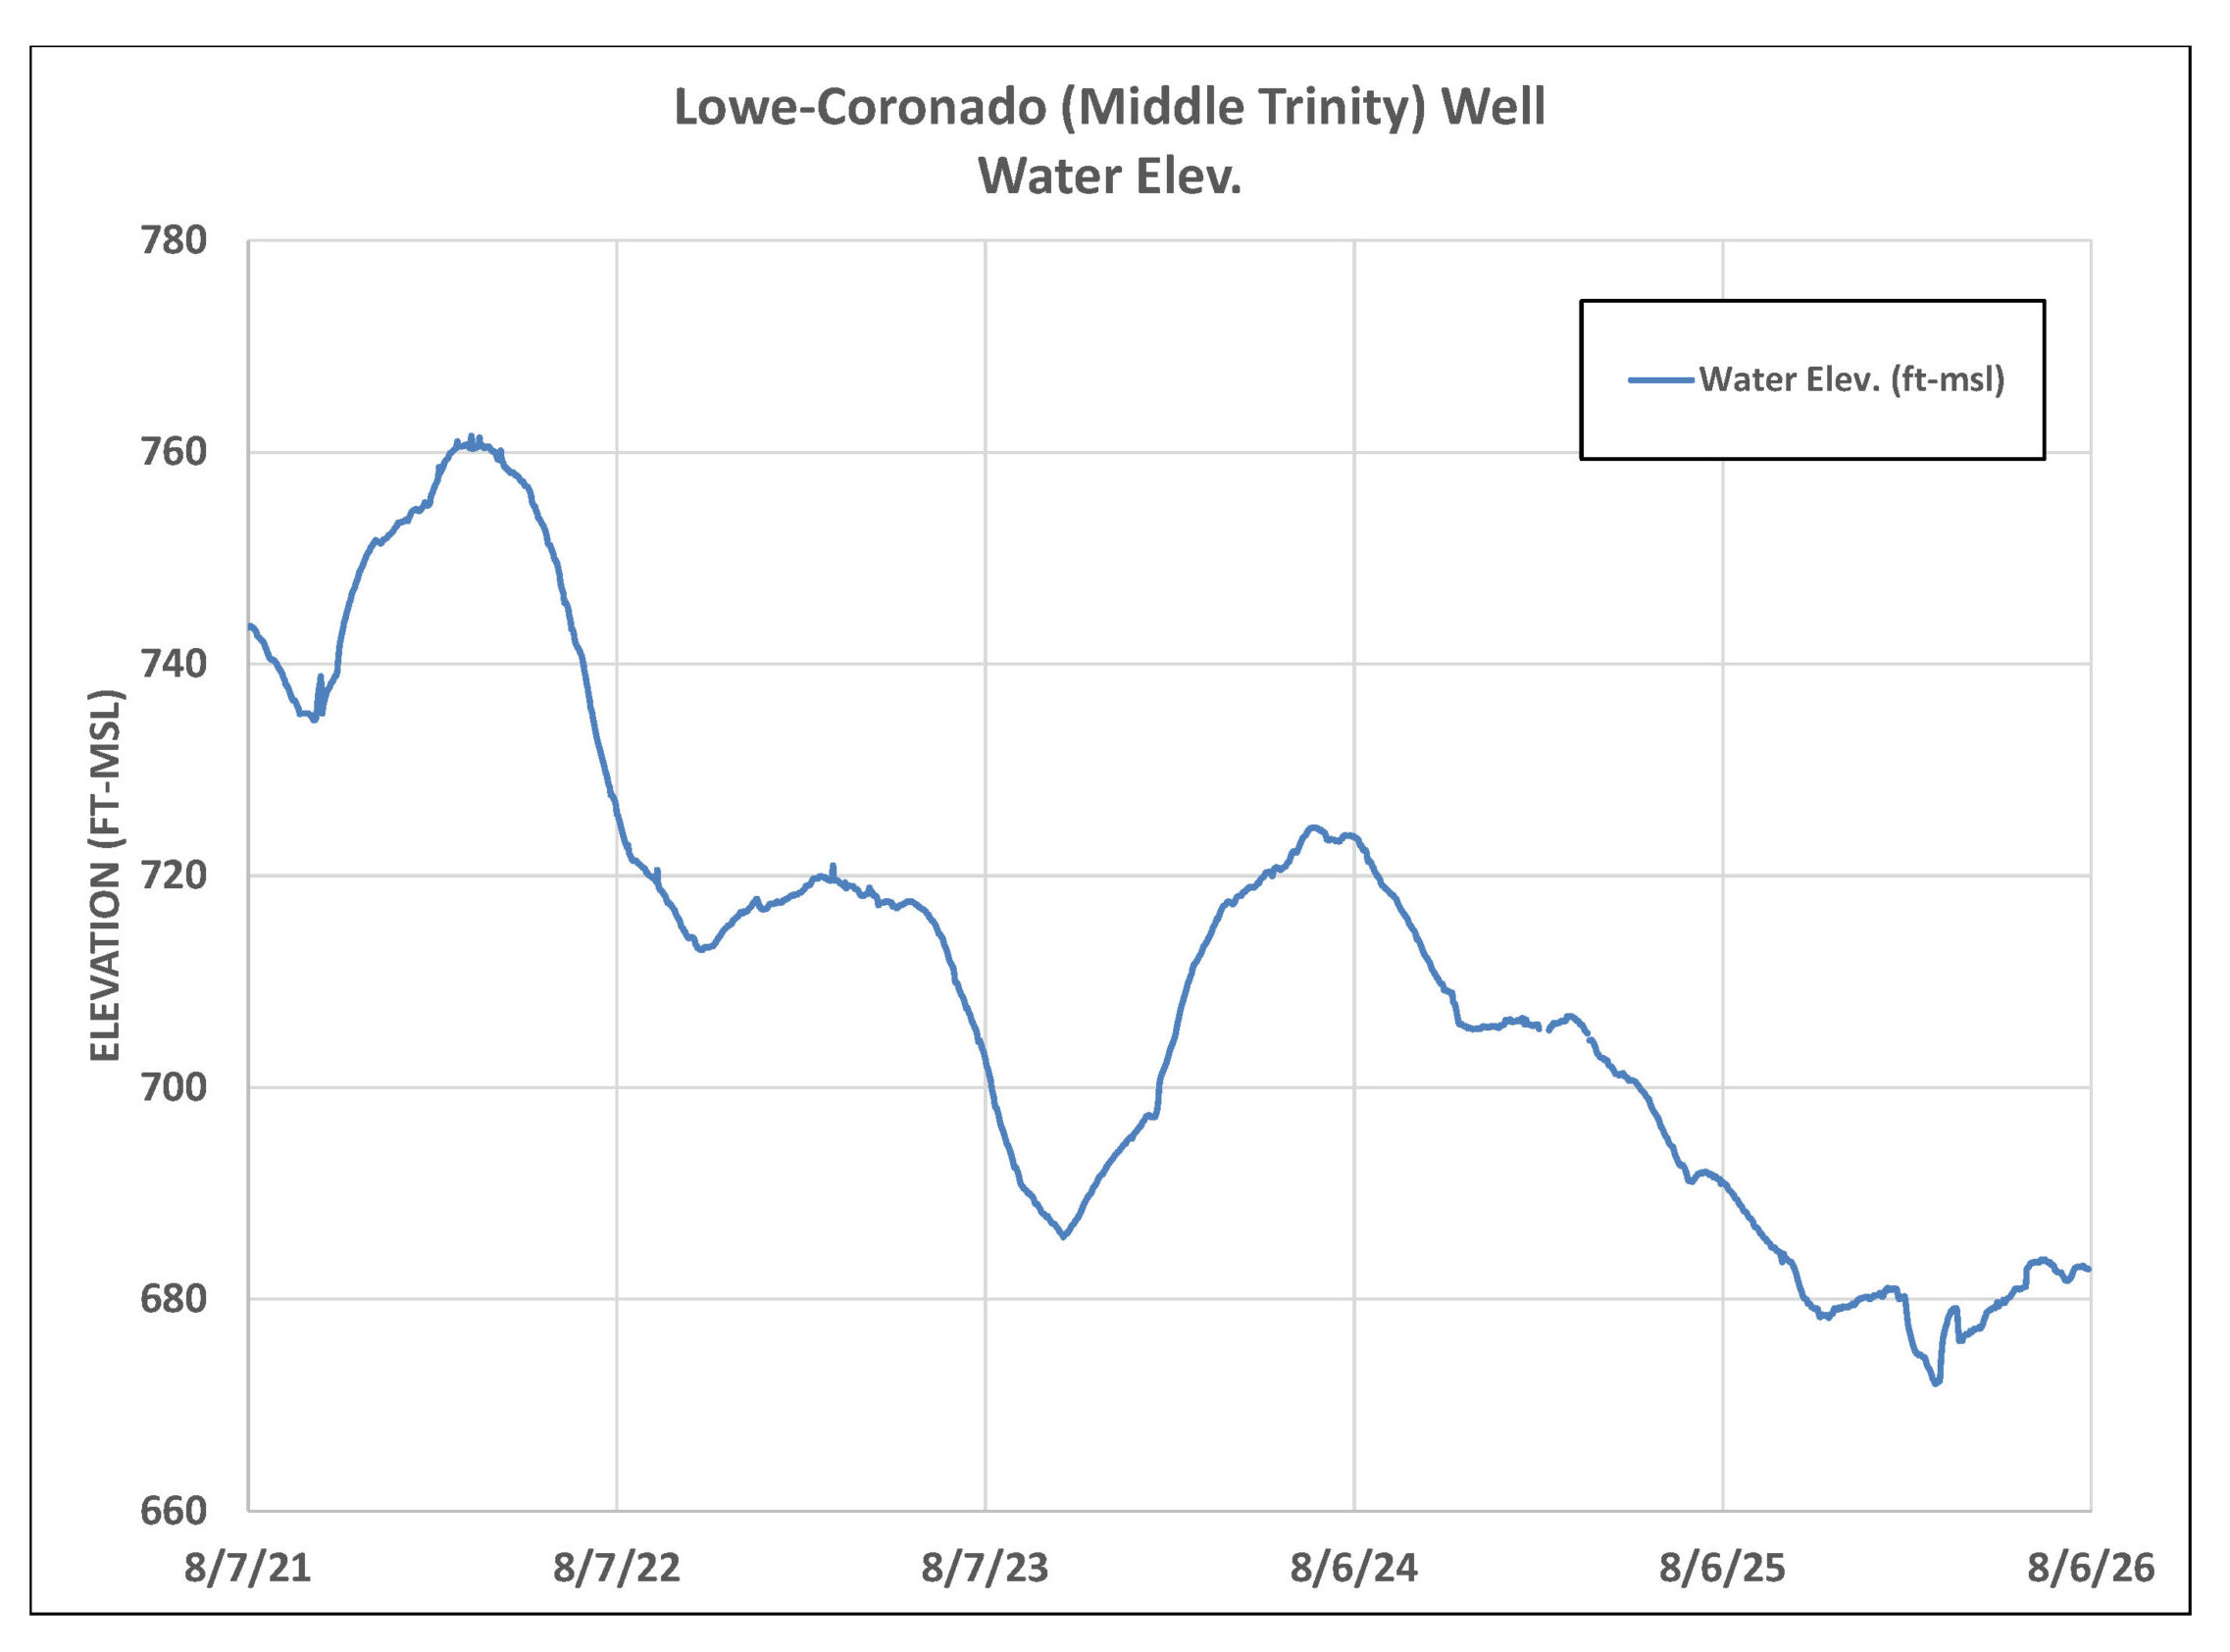
Figure 6. Lowe-Coronado (Middle Trinity) monitor well water-level elevation.
Outlook
The last 4 months have provided above average rainfall and an encouraging response to our extended drought, and we remain on the path to recovery. As a practical estimate, the District would probably need another 12 to 16 inches of well-distributed rainfall through the fall and early winter, including several events large enough to produce sustained creek flow across the recharge zone. That would bring the 2026 rainfall total close to or somewhat above the historical annual average (36 inches) and could provide enough recharge to move both Barton Springs flow and Lovelady water levels to lesser severe stages of drought, with some buffer.
The Climate Prediction Center’s outlook for August through October favors above-average temperatures across Texas, with increased chances of below-average rainfall in Central Texas (Figure 7). While recent rainfall has improved aquifer conditions and provided meaningful recharge, a full recovery will depend on continued rainfall in the months ahead. Until then, the District encourages all community members to continue using water wisely as the region remains on the path to recovery.
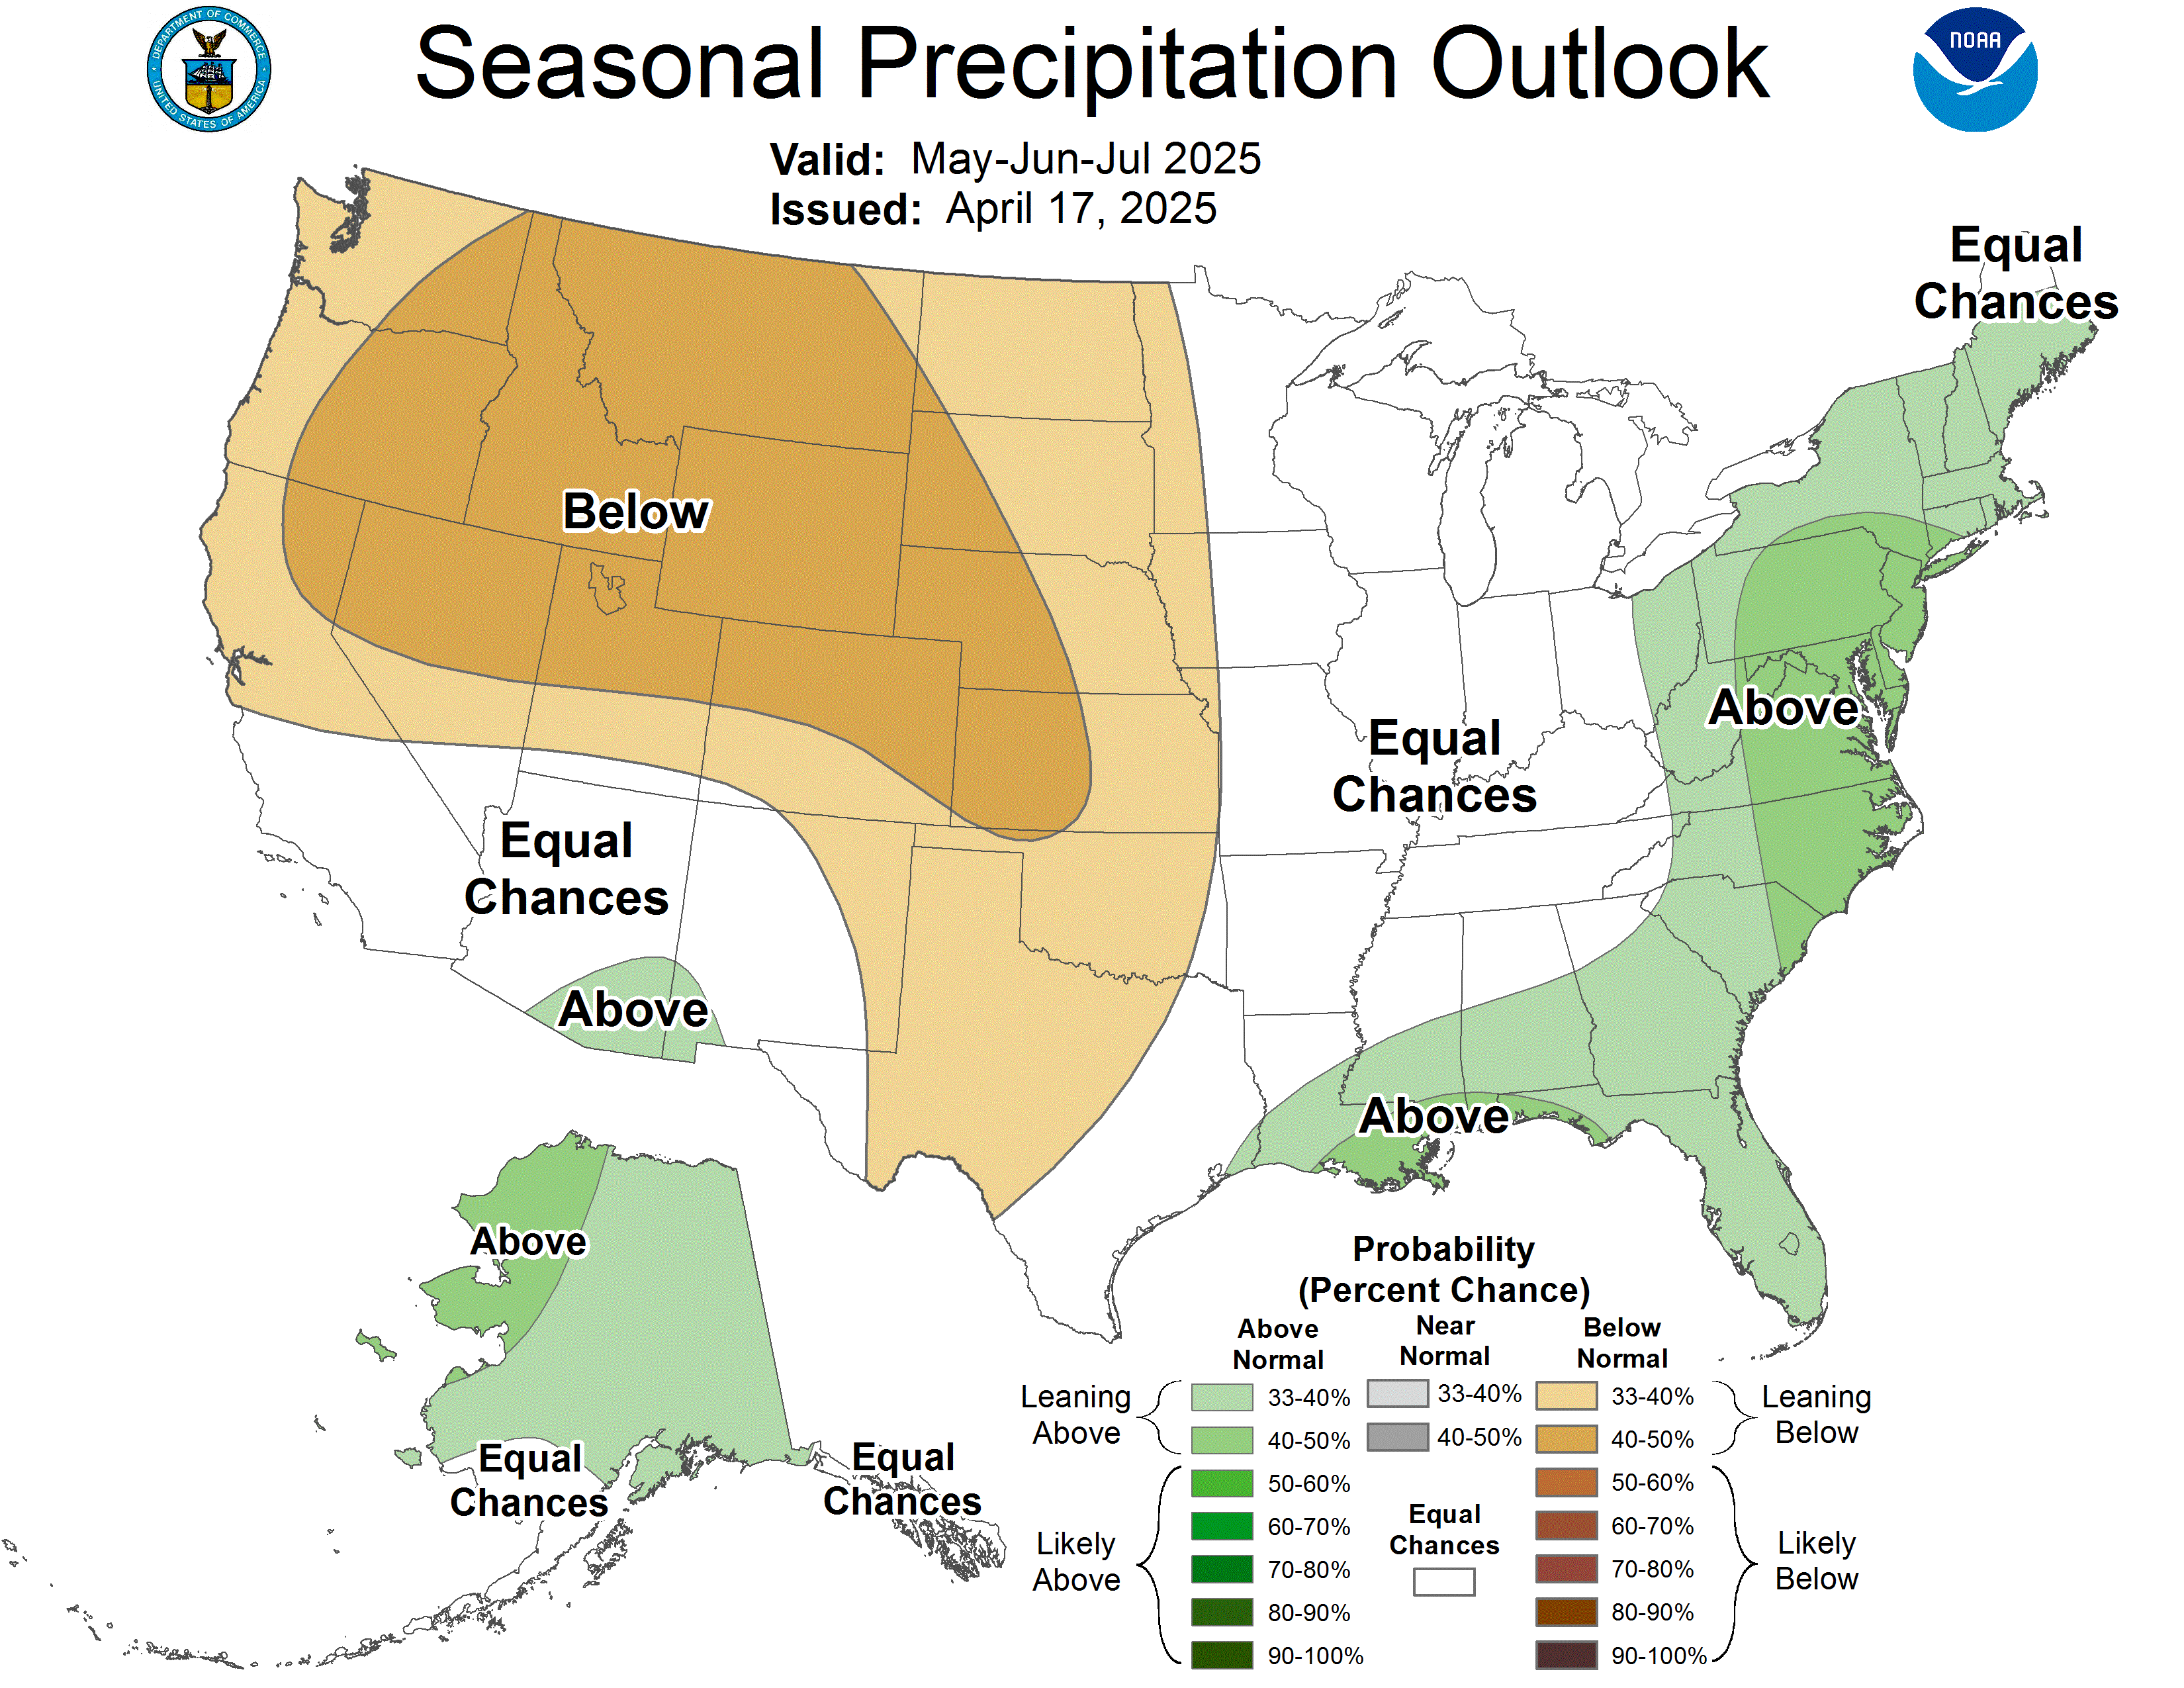
Figure 7. August-September-October Seasonal Precipitation Outlook for the US according to the climate Prediction Center.
Looking for more information? Get in touch with us at geninfo@bseacd.org