
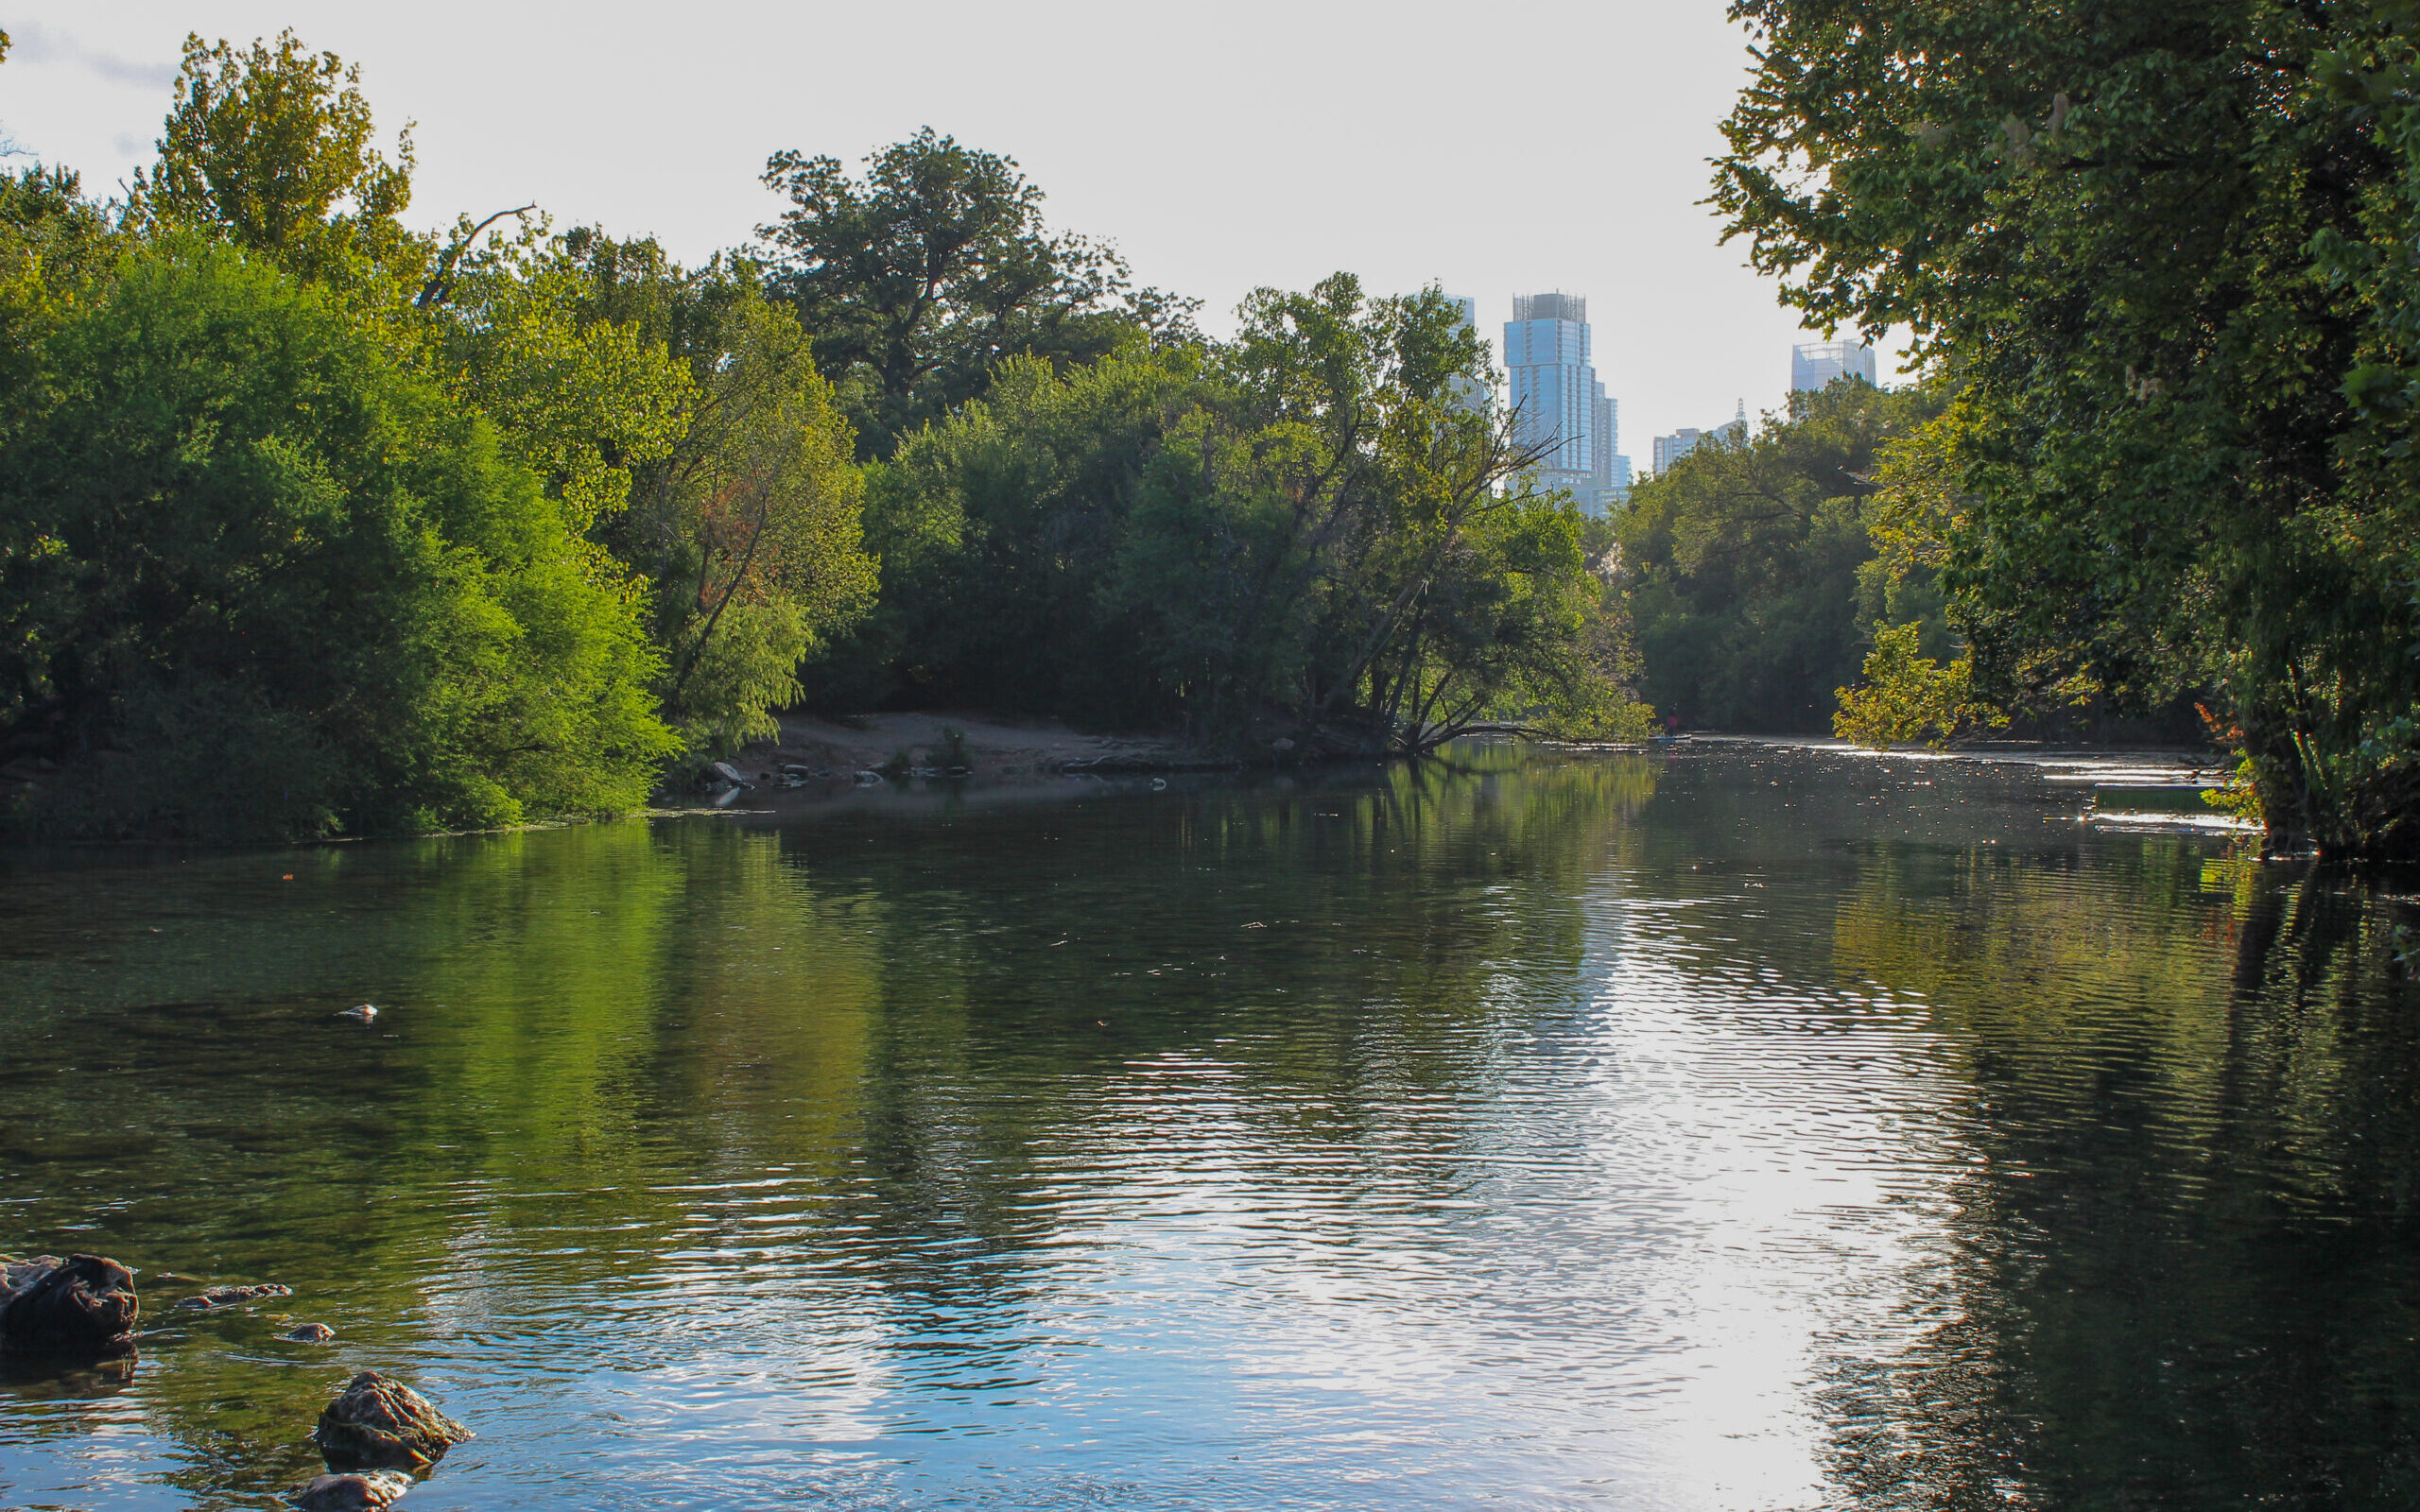
Photo of Barking Springs taken on August 12, 2026.
District’s Current Drought Status: Stage 3 Exceptional Drought
August brought another round of triple-digit heat to Central Texas, with both Austin-Bergstrom International Airport (ABIA) and Camp Mabry recording temperatures at or above 100°F. Twenty-nine days reached the century mark during the month and placed August 2026 as the 5th hottest month on record. This marks a shift back to drier conditions, ending a four-month streak of above-average rainfall.
Although rainfall earlier this year improved aquifer conditions, the return of hot, dry weather in August shows that Central Texas still needs sustained, above-average rainfall to produce a lasting recovery from the drought.
Recognizing these seasonal risks, the Board elected to remain in Stage 3 despite the early-summer improvements. The recent decline in water levels and springflow reinforces that decision, as aquifer conditions have deteriorated quickly during this extended period of hot, dry weather and elevated groundwater use.
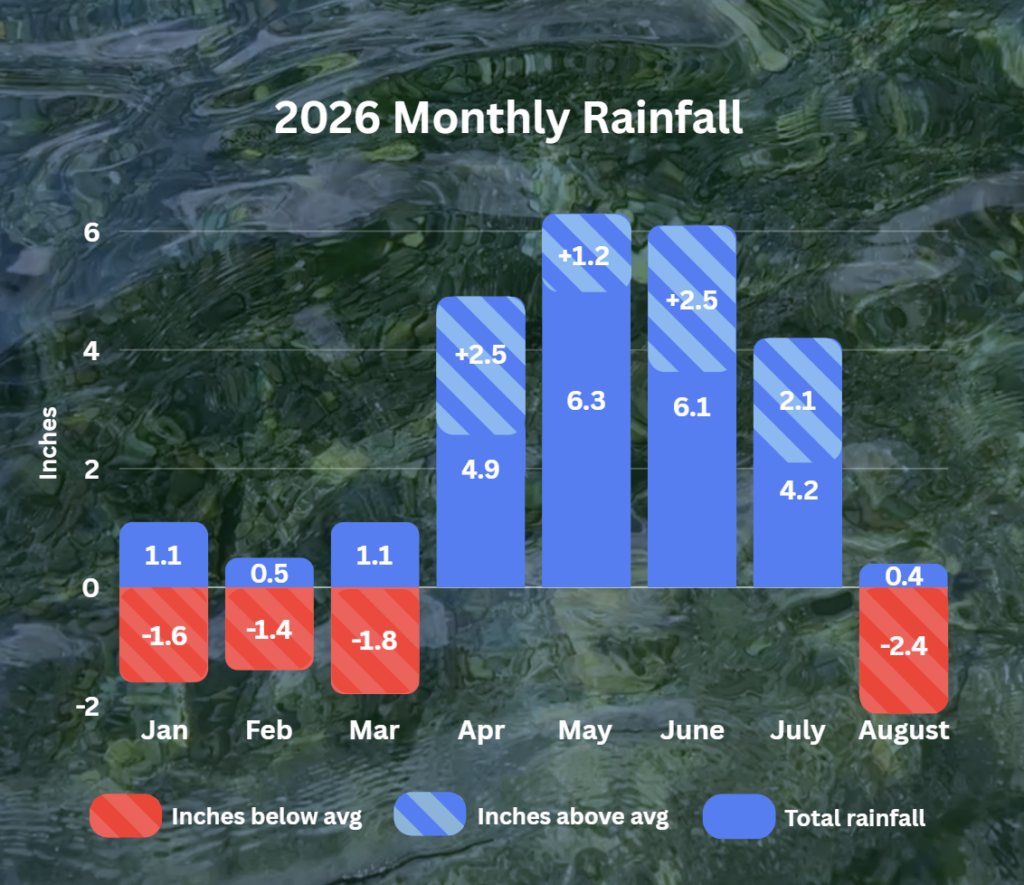
Figure 1. Monthly deviation from average and monthly total rainfall in District’s territory for 2026.
Rainfall Recap
Total August rainfall averaged approximately 0.36 inches across the Camp Mabry and Austin-Bergstrom International Airport (ABIA) weather stations – about 2.4 inches below the long-term monthly average and placing it as the 28th driest August on record (Figure 1).
Through August 2026, Central Texas has received approximately 23.7 inches of rainfall, or about 65% of the historical annual average of 36 inches.
The lack of rainfall in August has contributed to declining water levels in Edwards and Trinity aquifer monitoring wells across the District. About 12 inches of additional rainfall will be needed through the remainder of the year to reach the historical annual average (Figure 2). Rainfall during September and the fall months will be important for slowing current water-level declines and improving regional aquifer conditions.
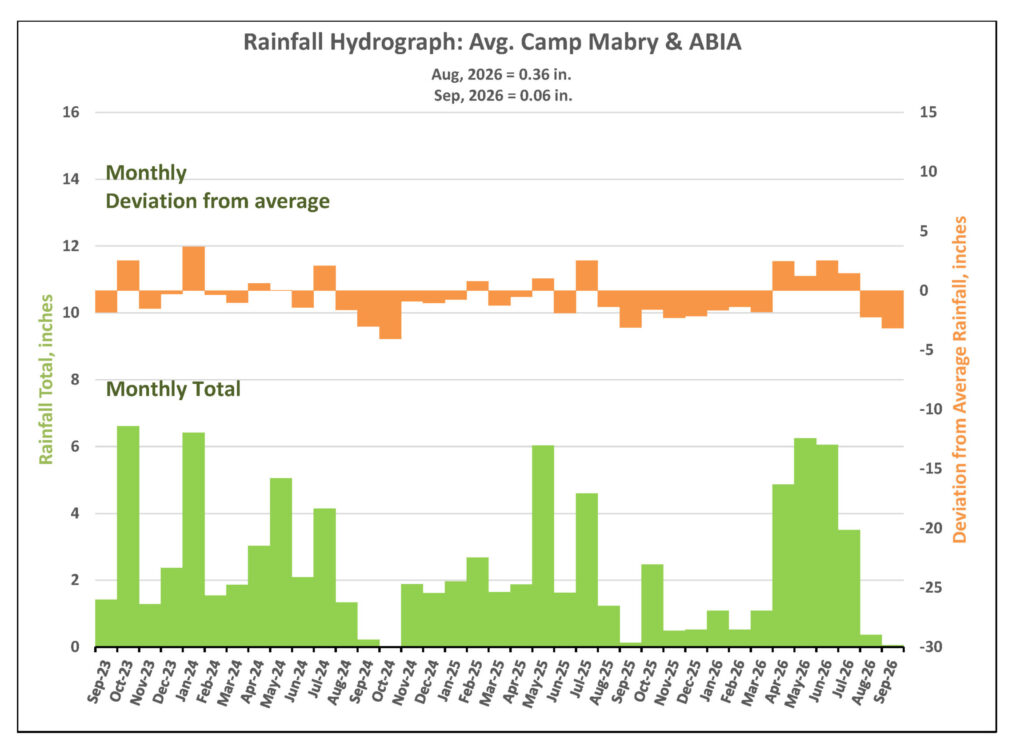
Figure 2. Monthly deviation from average and monthly total rainfall in District’s territory.
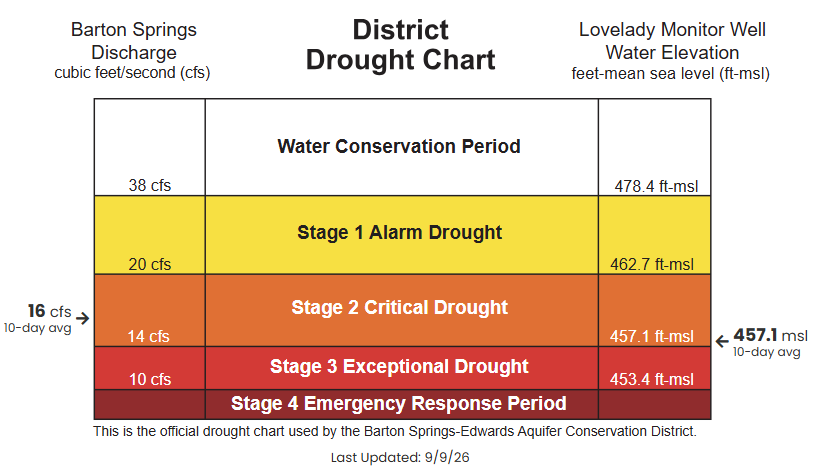
Figure 3. District Drought Chart as of 8/6/2026 displaying 10-day averages for springflow at Barton Springs (left) and groundwater levels at Lovelady monitor well (right)—both of which play a role in determining the District’s drought stage.
Barton Springs Flow
As of September 9, the 10-day average discharge at Barton Springs is 16 cubic feet per second (cfs) (Figure 4). The effects of a very dry August have wiped out most of the improved springflow gained from four consecutive months of above-average rainfall, highlighting how quickly aquifer conditions can respond to prolonged periods without meaningful rainfall.
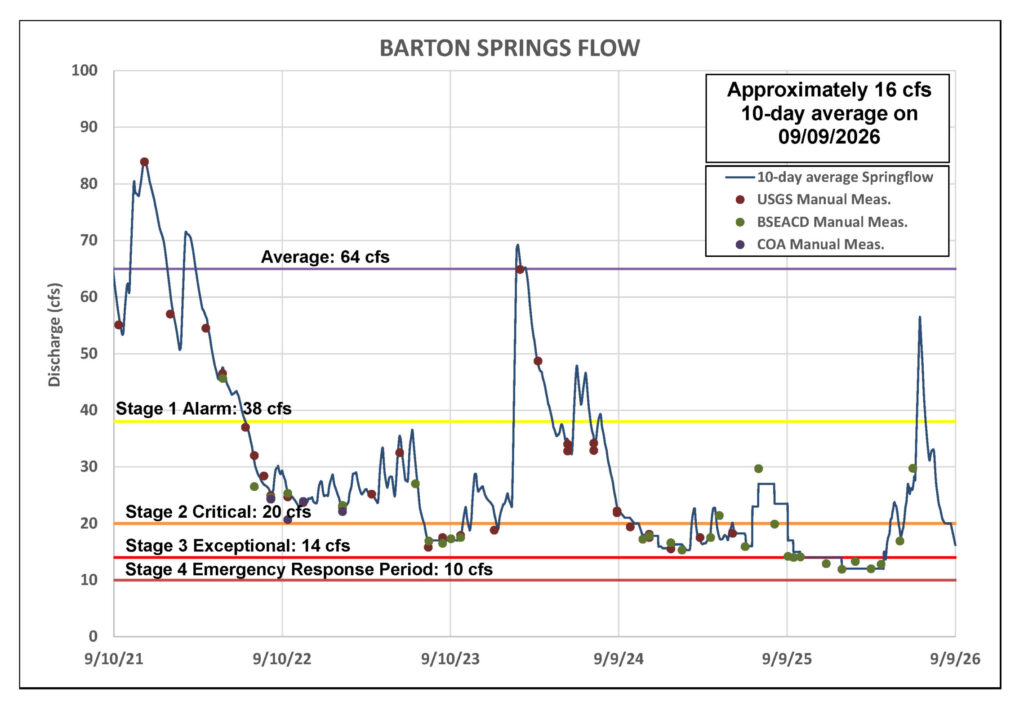
Figure 4. Barton Springs flow for the last five years.
*Note: Recent data for Barton Springs looks blockier than earlier, smoother records because it’s based on the average of two recent manual measurements, rather than continuous USGS gauge data.
Lovelady Monitor Well
As of September 9, the 10-day average water level at the Lovelady Monitor Well is 457.1 feet above mean sea level (ft-msl), placing the District back within the Stage 3 Exceptional Drought threshold (Figure 5).
While the encouraging rains from April through July improved aquifer conditions and kept the District from entering the unprecedented Stage 4 Emergency Response threshold, those gains have proven short-lived. Just two months later, Lovelady water levels have returned to Stage 3 as the typically dry summer months and seasonal increases in groundwater demand have taken effect.
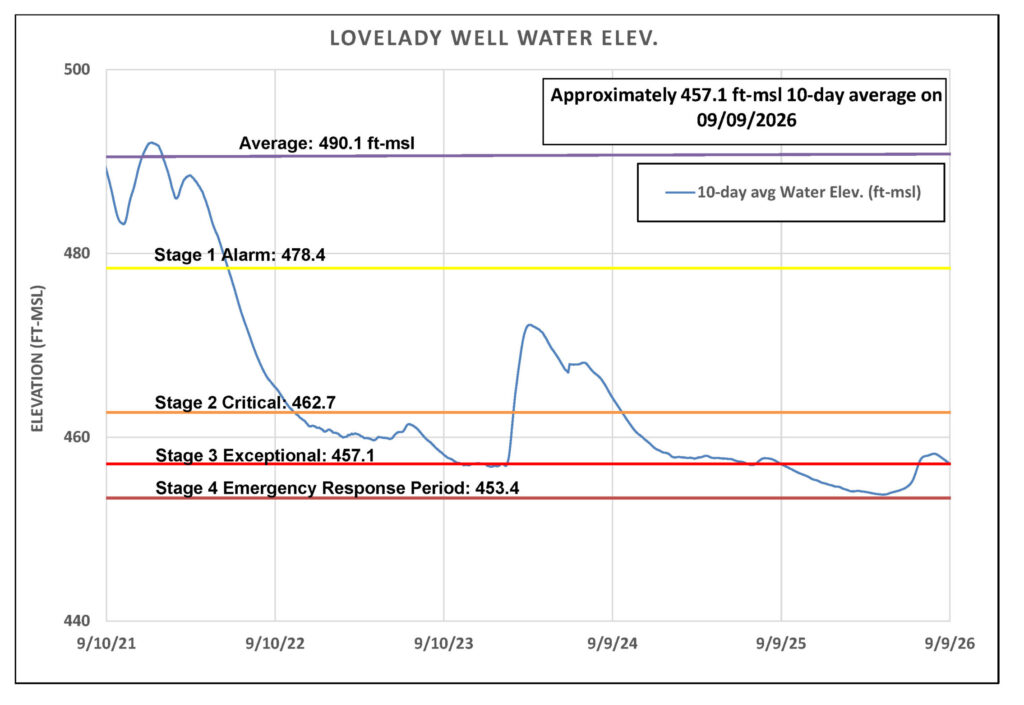
Figure 5. Lovelady groundwater level over the last five years.
Trinity Aquifer
Groundwater levels in the Trinity Aquifer, which also benefited from the spring and early-summer rains, have returned to declining trends. The Lowe-Coronado Middle Trinity monitor well reached its recent peak following rainfall in late June but has been steadily declining since late July (Figure 6). Similar declines are also observed in the Upper Trinity Aquifer.
Surface-water conditions reflect the same drying trend. Jacobs Well Spring has been reporting near-zero flow since mid-August, while the Blanco River at Wimberley has remained a below-normal flows between 5 and 6 cfs.
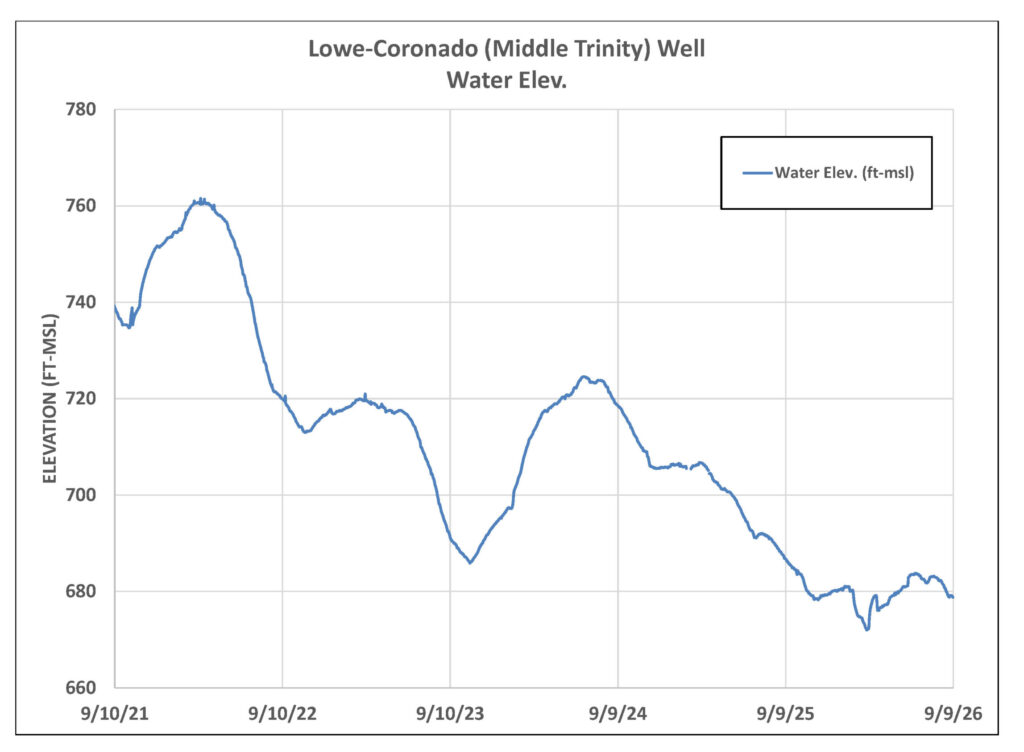
Figure 6. Lowe-Coronado (Middle Trinity) monitor well water-level elevation.
Outlook
After four months of above-average rainfall, August brought just 0.4 inches of rain, that’s 2.4 inches below average. The return to dry conditions has limited additional recharge and contributed to aquifer indicators beginning to decline again. However, there is still some reason for cautious optimism: September is historically one of the wetter months of the year in Central Texas, ranking as the region’s fourth wettest with an average of approximately 3.5 inches of rainfall.
The Climate Prediction Center’s outlook for September through November favors above-average temperatures across Texas, with chances of below-average rainfall in Central Texas (Figure 7). While early summer rainfall improved aquifer conditions, sustained recovery will depend on additional well-distributed rainfall and recharge through the fall and early winter.
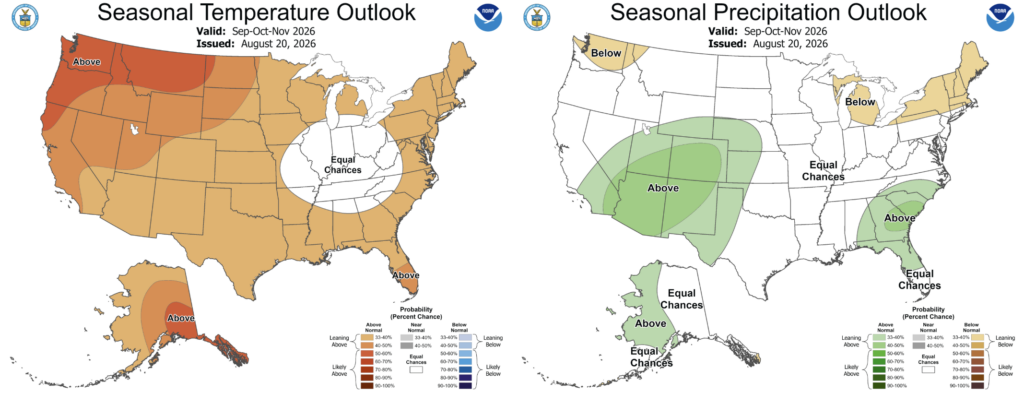
Figure 7. September-October-November Seasonal Precipitation Outlook for the US according to the climate Prediction Center.
Looking for more information? Get in touch with us at geninfo@bseacd.org