Rainfall
September was extremely dry in Central Texas. Camp Mabry picked up only 0.08 inches of rain, and Austin–Bergstrom International Airport (ABIA) saw just 0.18 inches. On average, that’s only 0.13 inches across the area – far short of the usual 3.2 inches we expect in September (Figure 1). That 3-inch shortfall is especially important because September is normally Central Texas’ fourth-wettest month, often helped along by tropical systems during hurricane season. Instead, with no storms forming in the Gulf, September 2025 went down as the fifth driest on record at Camp Mabry. The result: dry conditions persisted and the drought grew worse.
Looking at 2025 as a whole, Central Texas is currently only about 5 inches below the year-to-date average. However, the region still faces a deep cumulative deficit of roughly 25 inches over the past three years. This long-term shortfall has exacerbated drought conditions. At the September 11 Board meeting, officials declared Stage 3 Exceptional Drought (previously known as Stage IV Exceptional Drought), after water levels in the Lovelady monitor well fell below the Stage 3 Exceptional threshold.
Looking ahead, October ranks as the second-wettest month, with an average of 3.9 inches of rain. However, forecasts for October and the remainder of 2025 point to a drier-than-normal pattern as the most likely outcome.
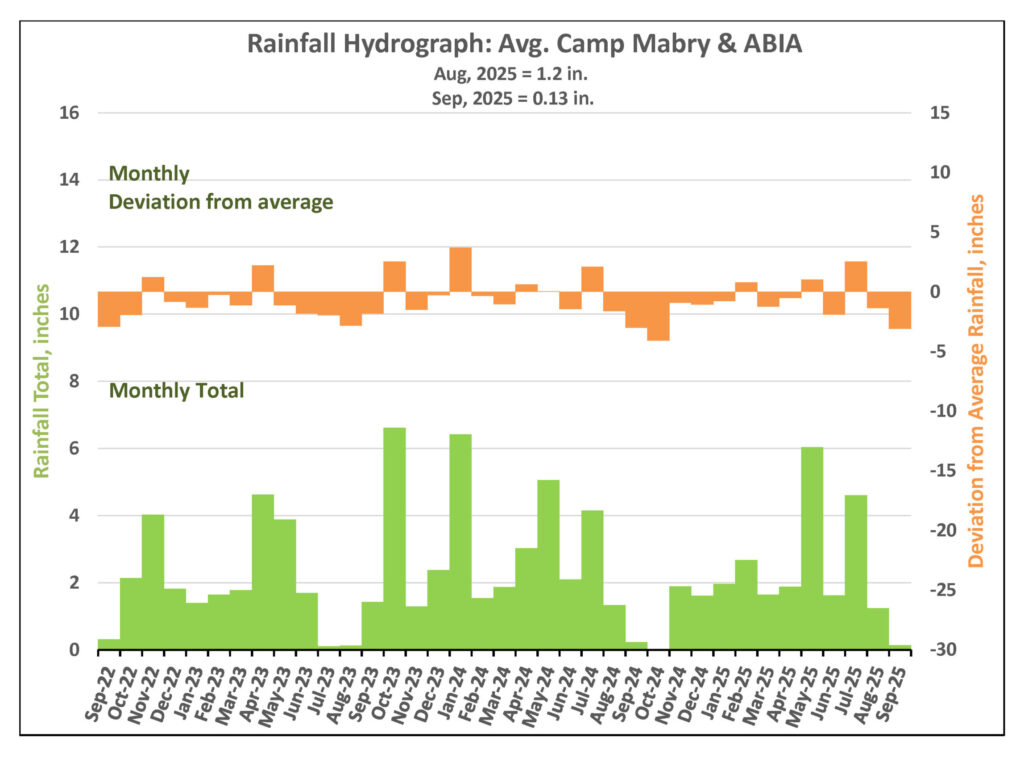
Figure 1. Monthly deviation from average and monthly total rainfall in District’s territory.
Drought Triggers and Status
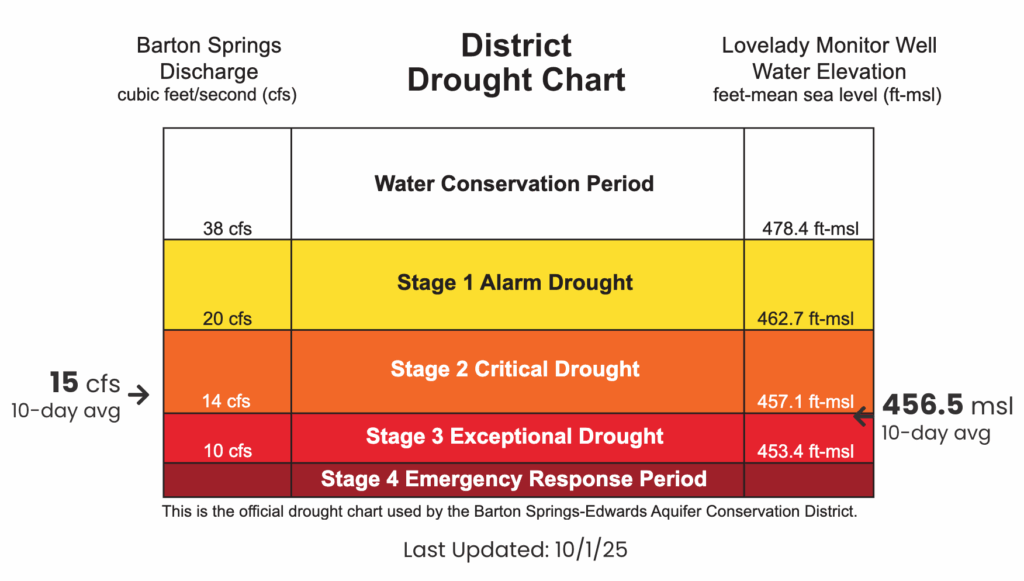
District Drought Chart as of October 1, 2025 displaying 10-day averages for springflow at Barton Springs (left) and groundwater levels at Lovelady monitor well (right)—both of which play a role in determining the District’s drought stage.
Barton Springs Flow
September brought almost no rainfall, and when added to the dry August before it, the lack of recharge has caused Barton Springs flow to continue its steady decline. (Figure 2). Note: The most recent data may look blockier than earlier, smoother records. This is because it’s based on 10-day averages from two manual measurements, rather than USGS gauge data every 15 minutes. Manual measurements provide more reliable results during very low flows, since real-time gauge data can be distorted by pool operations (such as plugging dam outflows to maintain pool levels).
As of October 2, the 10-day average flow at Barton Springs is about 14.5 cubic feet per second (cfs). This estimate comes from the two most recent manual measurements: 14.2 cfs on September 11 and 14.7 on September 23. The next manual measurement is scheduled for October 8.
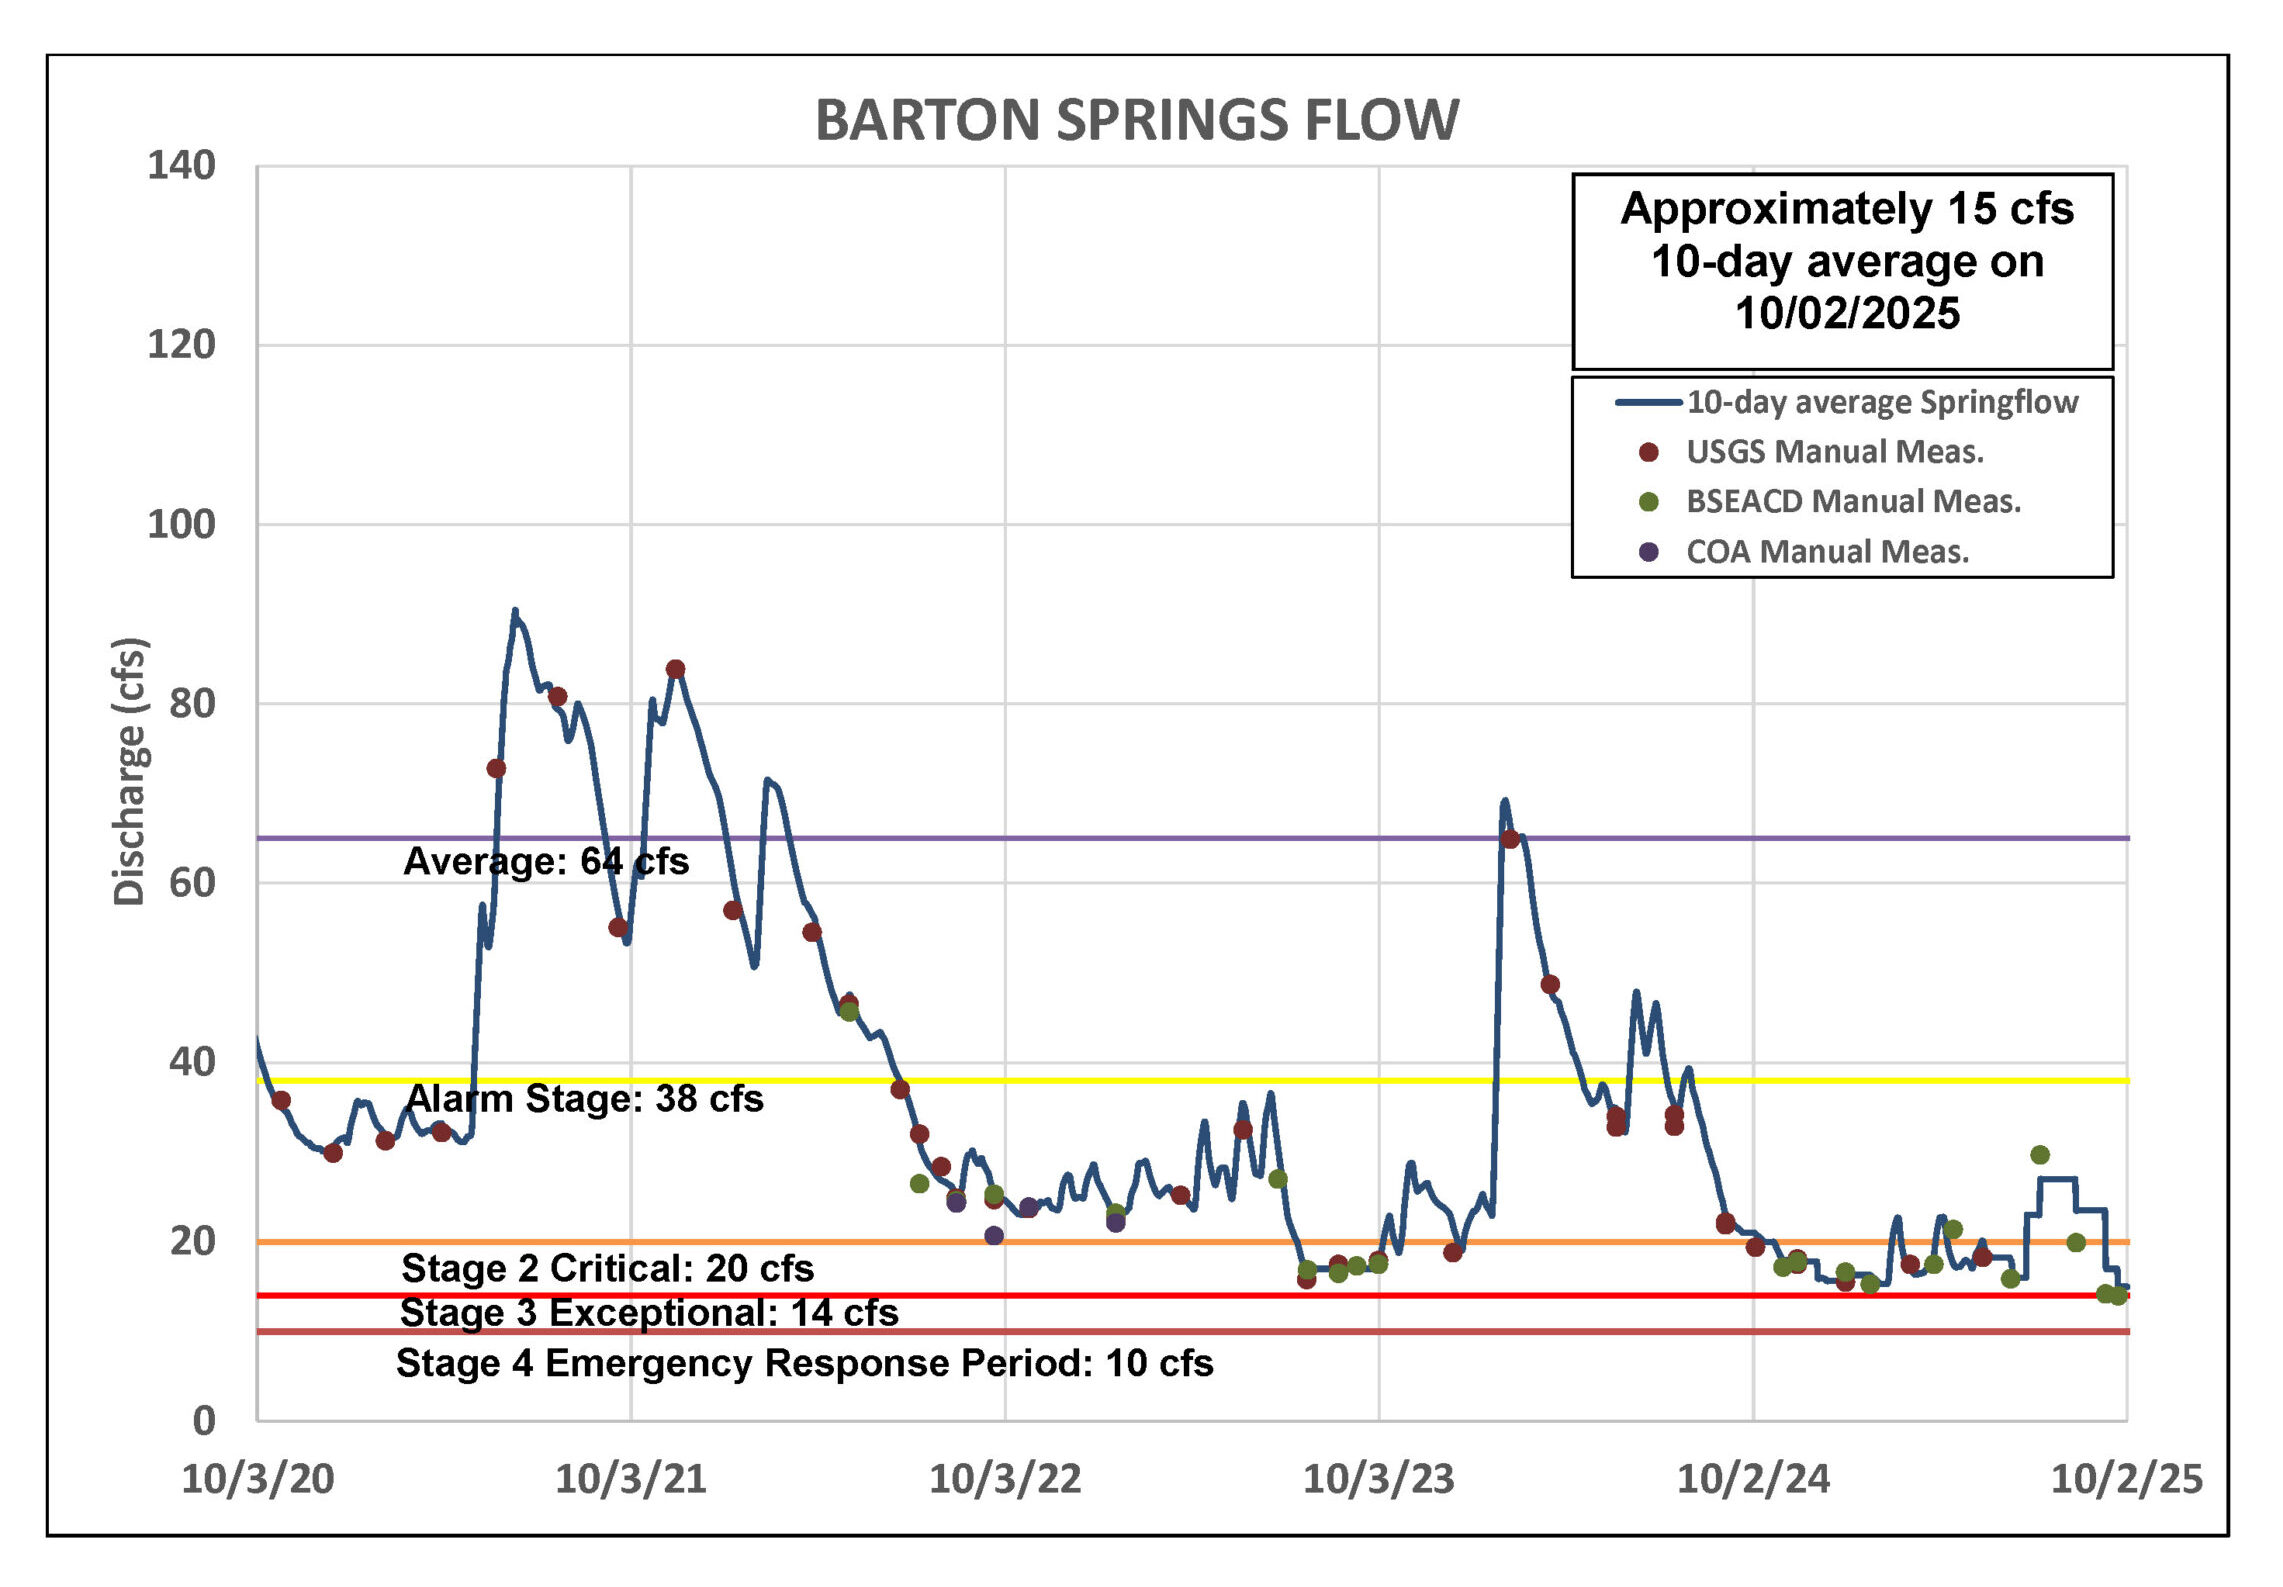
Figure 2. Barton Springs flow for the last five years.
Lovelady Monitor Well
On September 8 – just four days before the September 11 Board meeting – groundwater levels at the Lovelady monitor well dropped into the Stage 3 Exceptional Drought threshold (Figure 3). With September forecasts calling for drier-than-normal conditions and no significant rain expected, the Board voted to declare Stage 3 Exceptional Drought for only the second time in the District’s history (the first was on December 14, 2023).
As of October 2, the 10-day average water level at the Lovelady monitor well stood at 456.5 feet above mean sea level (ft-msl), placing it within the Stage 3 Exceptional Drought stage.
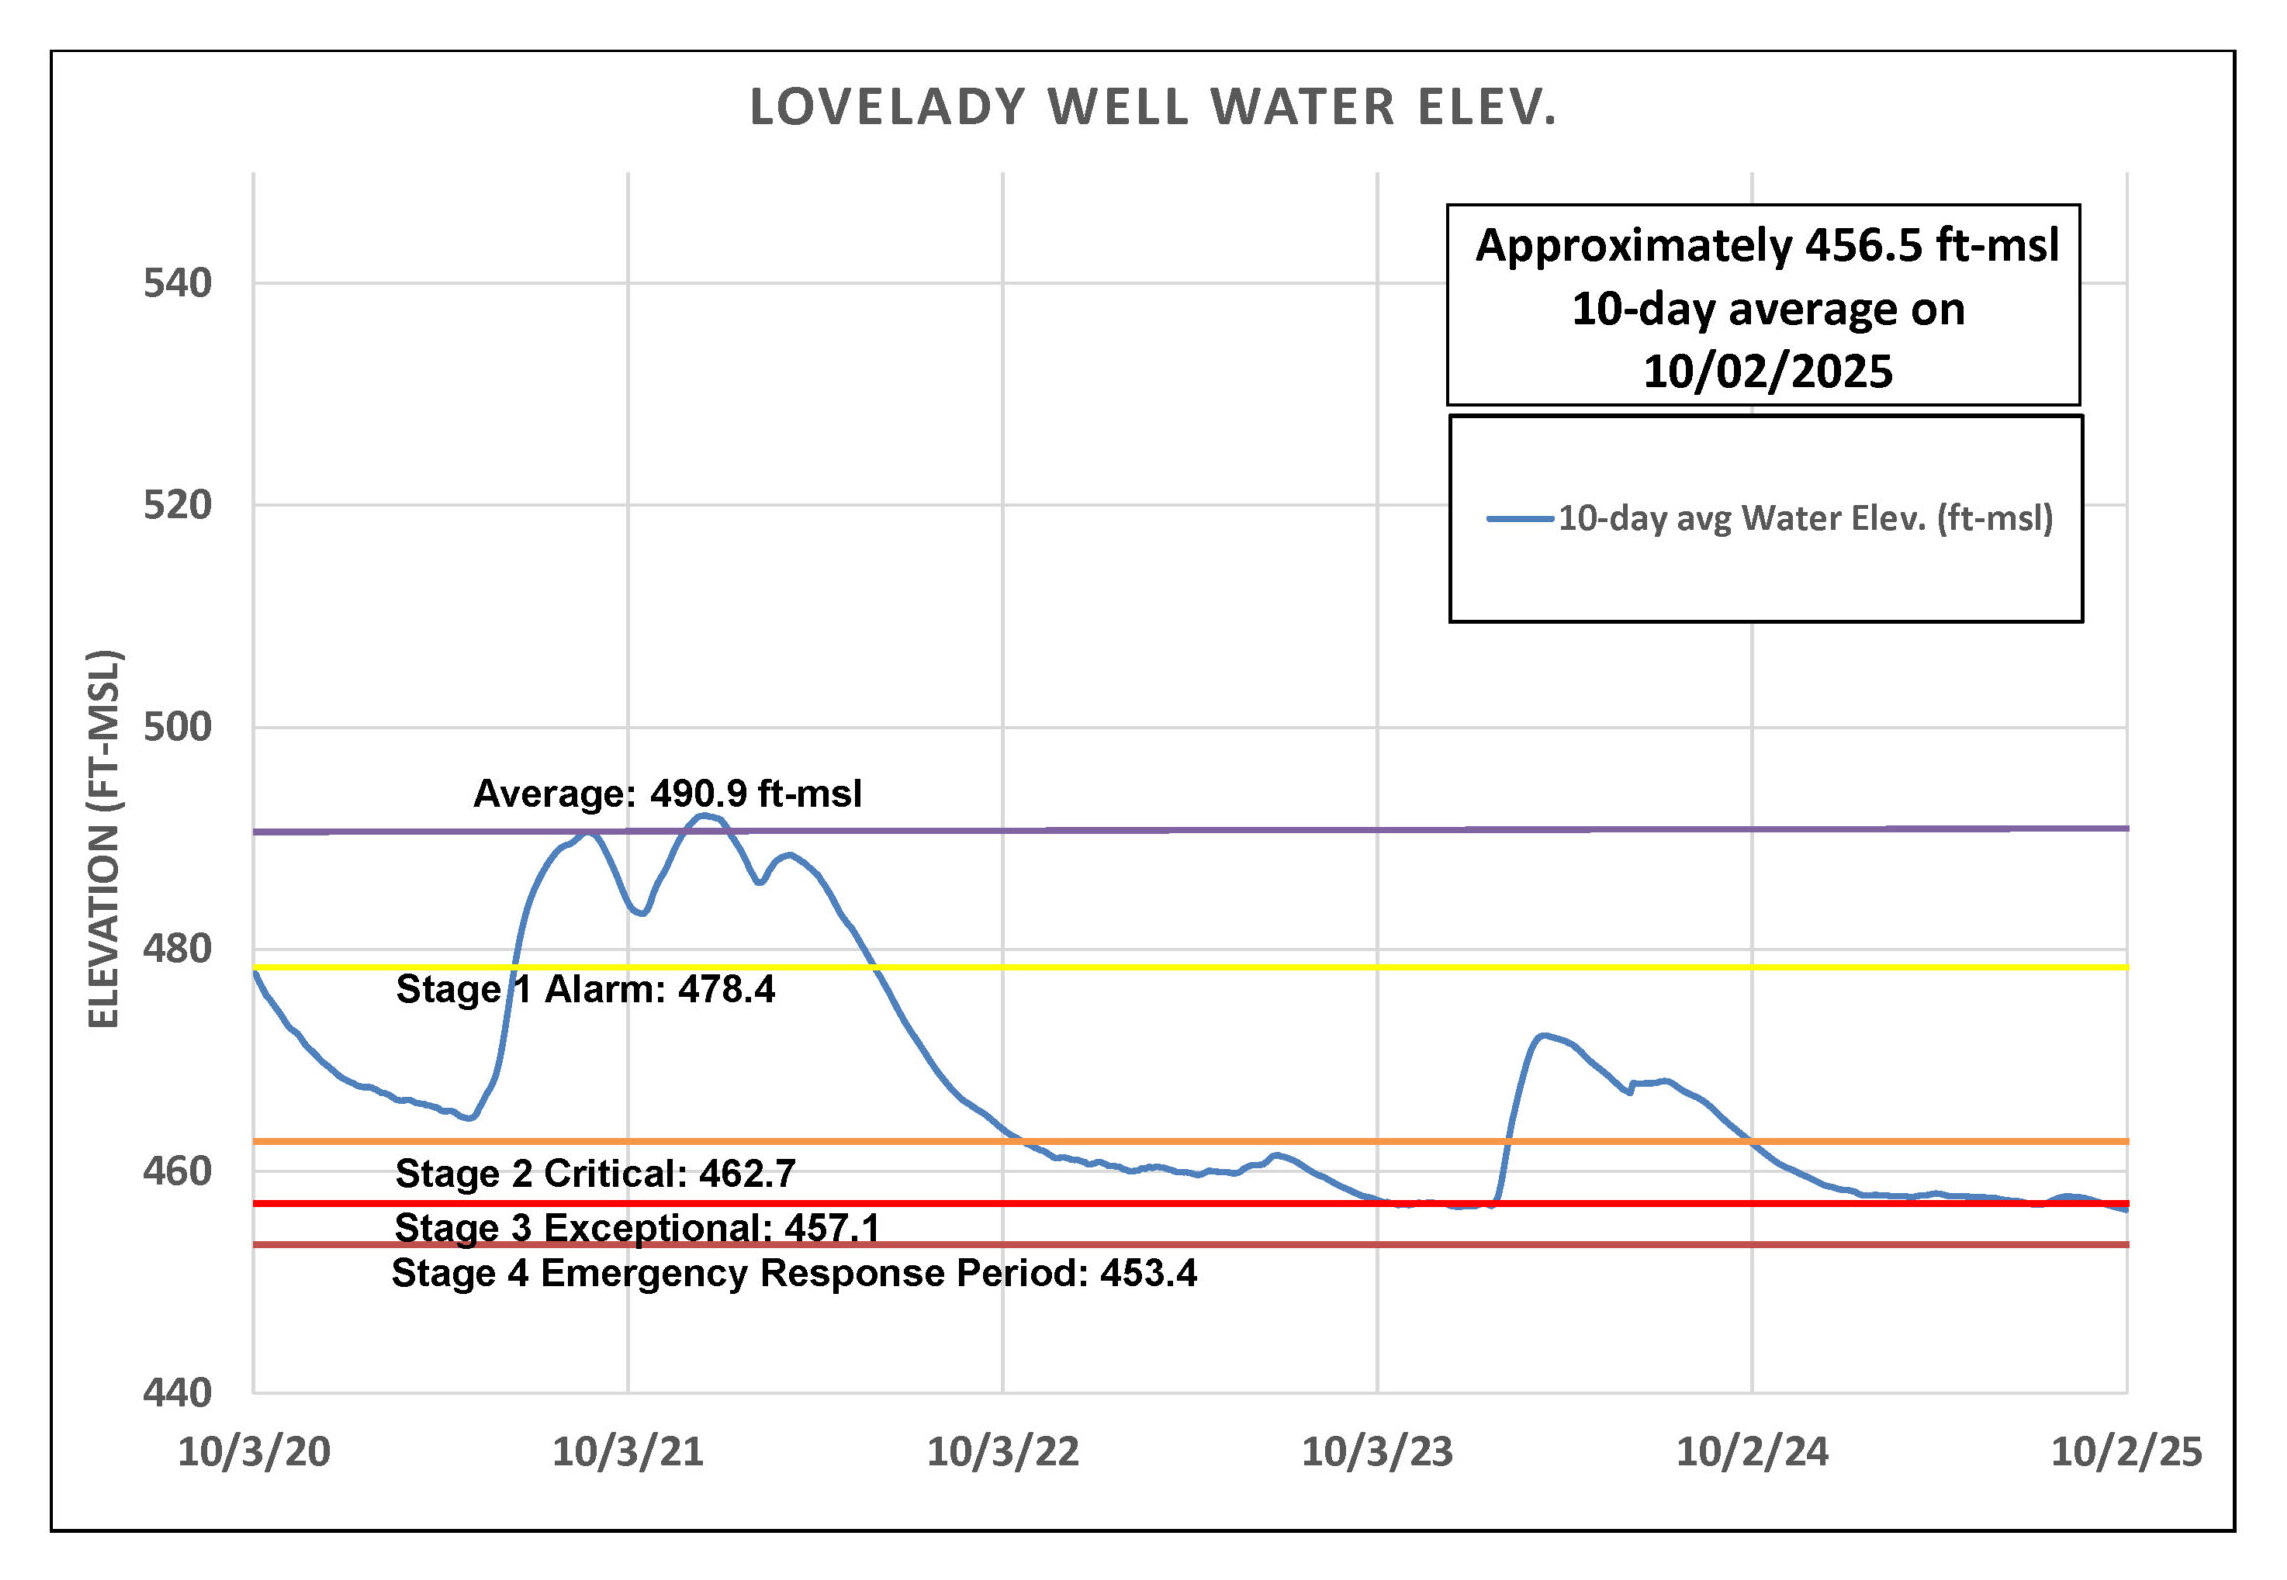
Figure 3. Lovelady groundwater level over the last five years.
Trinity Aquifer
The Lowe-Coronado Middle Trinity monitor well, located in the Rolling Oaks neighborhood of Driftwood, has been in steady decline since March 2025 (Figure 4). Current water levels here are the lowest recorded since monitoring began in 2015. This downward trend is consistent across all regional aquifers, including the overlying Upper Trinity.
Several shallow Upper Trinity wells in Central and Western Hays County are especially struggling in this prolonged drought, with water levels now comparable to those recorded in 2023 – the last time the District declared a Stage 3 Exceptional Drought.
As of September 4, the 10-day average flow at Jacob’s Well Spring (JWS) is just 0.04 cubic feet per second (cfs). The Blanco River at Wimberley briefly spiked to flows of 20–25 cfs after the valley received about 1.4 inches of rain in late August. However, those peaks were short-lived, and river flows have since dropped back down to 6–8 cfs, placing them within the lowest 25% of historical flow levels.
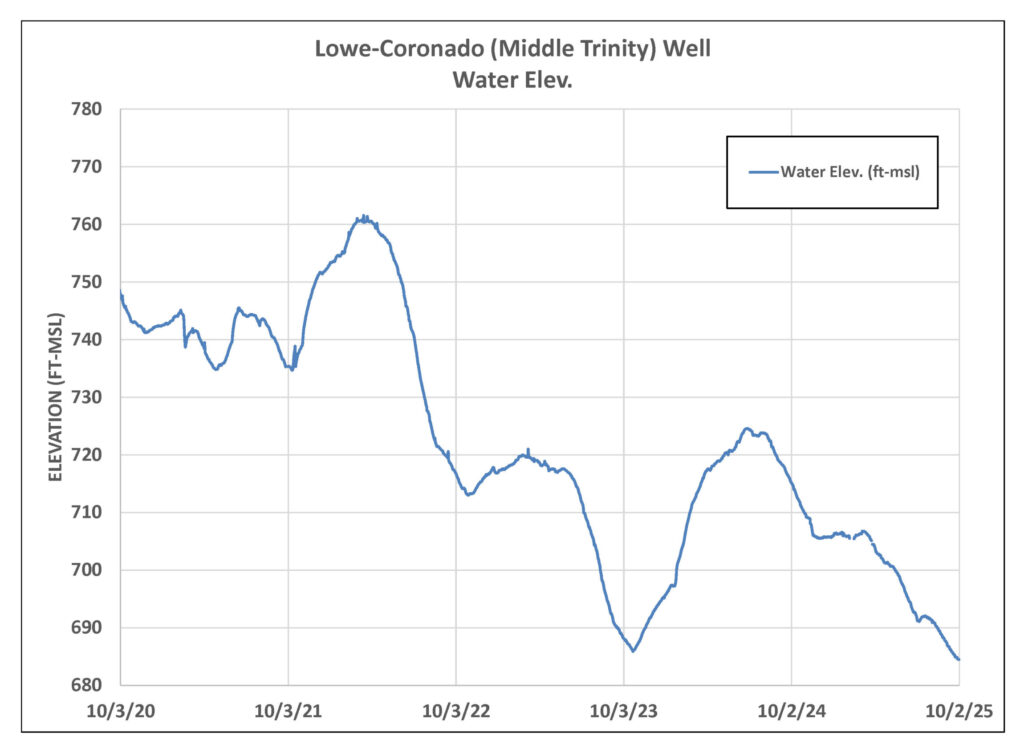
Figure 4. Lowe-Coronado (Middle Trinity) monitor well water-level elevation.