2025 Recap
While 2025 did not surpass Austin’s record for the hottest year, it still ranked among the city’s top five with an average temperature of 71.9°F. The hottest year on record remains 2024, with an average temperature of 72.7°F, followed by 2023 at 71.2°F.
Total rainfall for the year measured 29.2 inches based on combined data from Camp Mabry and Austin-Bergstrom International Airport (ABIA).
Looking ahead, January typically brings 1.5 to 2.5 inches of rain. However, with ongoing La Niña conditions, climatologists expect a warmer, drier winter. This means below-average rainfall is likely to continue through the end of the year and into early 2026.
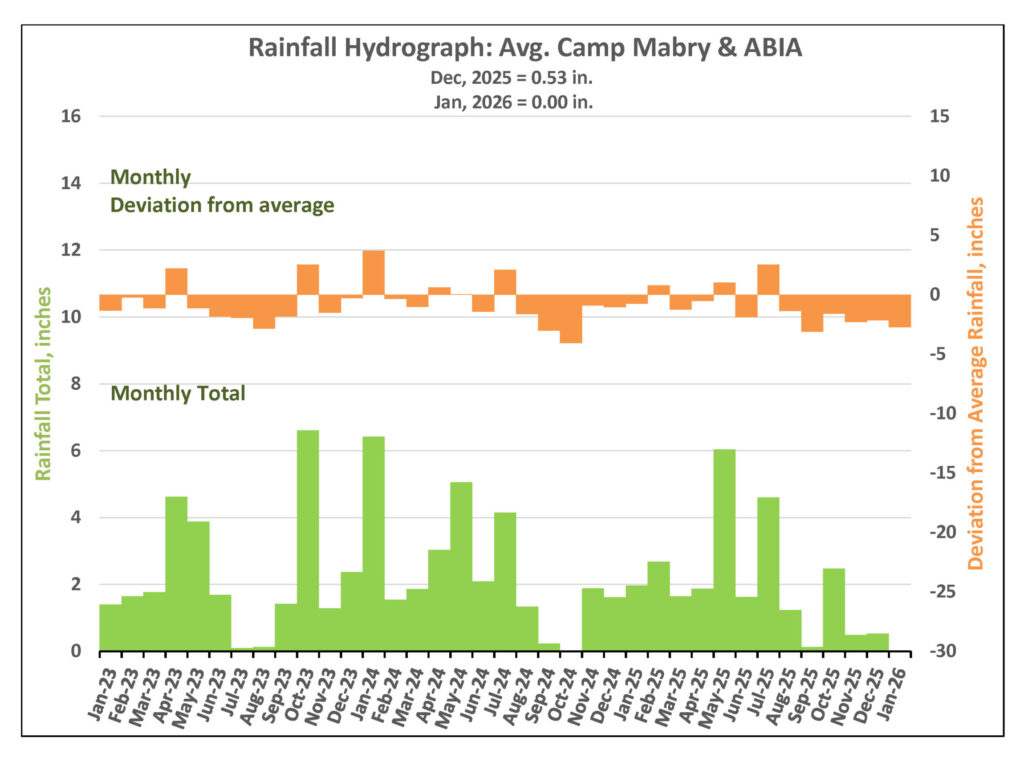
Figure 1. Monthly deviation from average and monthly total rainfall in District’s territory.
Drought Triggers and Status
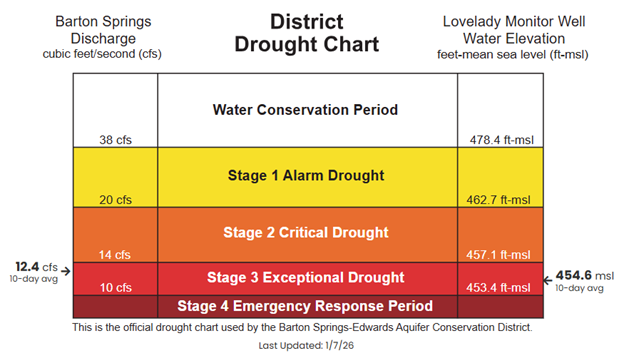
District Drought Chart as of January 7, 2026 displaying 10-day averages for springflow at Barton Springs (left) and groundwater levels at Lovelady monitor well (right)—both of which play a role in determining the District’s drought stage.
Barton Springs Flow
As of January 8, the 10-day average flow at Barton Springs is about 12.4 cubic feet per second (cfs) – just 2.4 cfs above the Stage 4 Emergency Response Period (ERP) threshold (Figure 2). The District has never declared Stage 4 ERP, but without meaningful rainfall, Barton Springs flows could drop into that range before spring 2026.
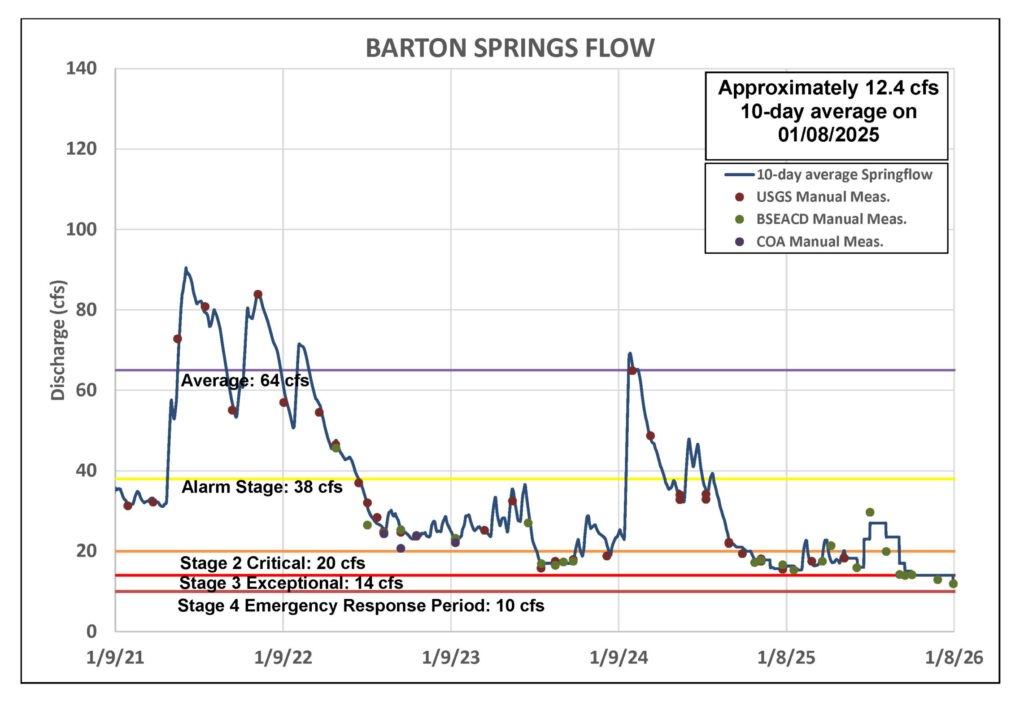
Figure 2. Barton Springs flow for the last five years.
*Note: Recent data for Barton Springs looks blockier than earlier, smoother records because it’s based on the average of two recent manual measurements, rather than continuous USGS gauge data.
Lovelady Monitor Well
As of January 7, the 10-day average water level at the Lovelady well is 454.6 feet above mean sea level (ft-msl), which is within the Stage 3 Exceptional Drought range but is only 1.2 feet above the Stage 4 Emergency Response threshold (Figure 3). Like Barton Springs, water levels could slip into Stage 4 Emergency Response by late March or early April 2026 if significant rainfall does not arrive.
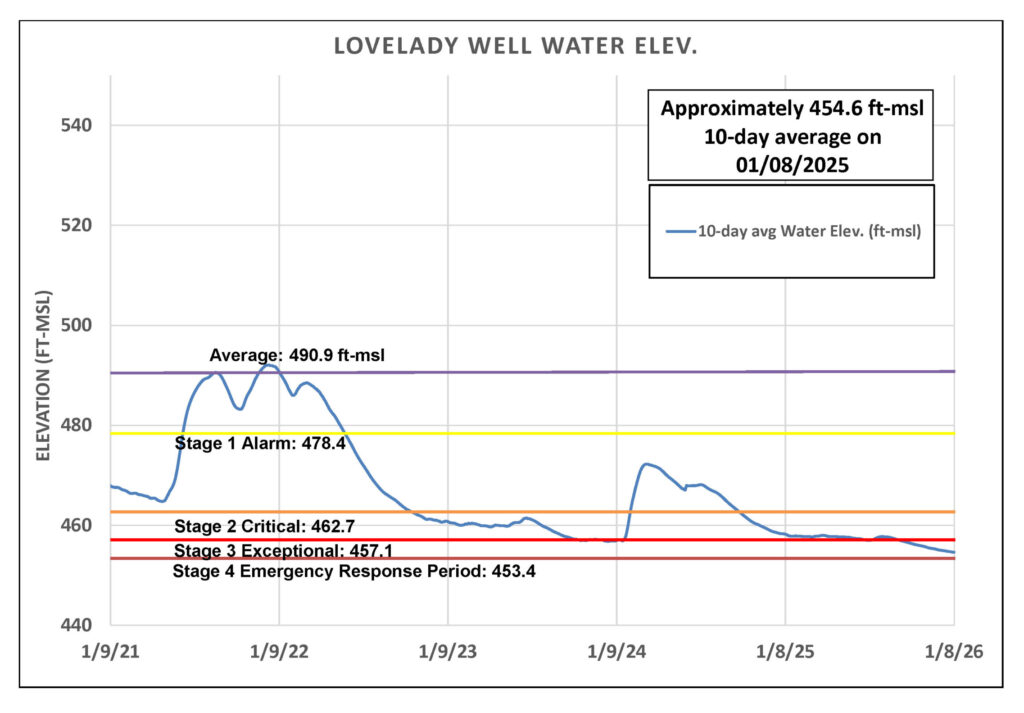
Figure 3. Lovelady groundwater level over the last five years.
Trinity Aquifer
Water levels at the Lowe-Coronado Middle Trinity monitor well have stabilized since early November, halting the previous decline and showing signs of a slight increase. Despite this improvement, groundwater levels remain at their lowest since monitoring began in 2015 (Figure 4). A similar modest rise is also evident in the overlying Upper Trinity Aquifer.
As of January 8, the 10-day average flow at Jacob’s Well Spring (JWS) is 0.00 cubic feet per second (cfs). The Blanco River at Wimberley is maintaining flows between 6-8 cfs.
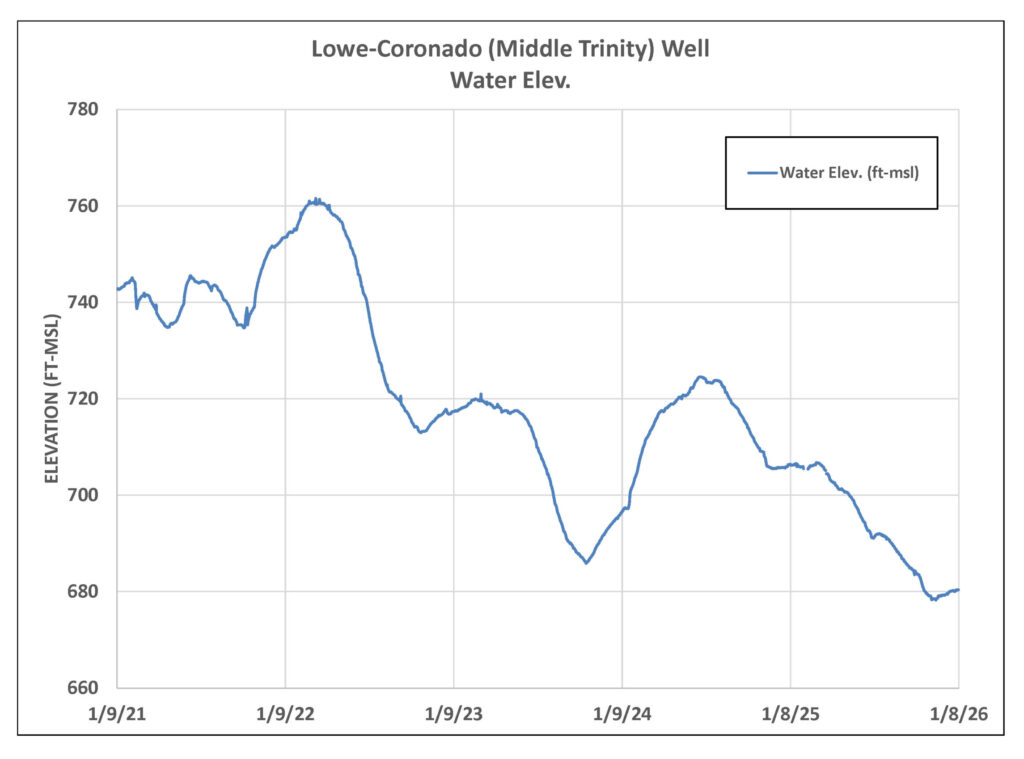
Figure 4. Lowe-Coronado (Middle Trinity) monitor well water-level elevation.