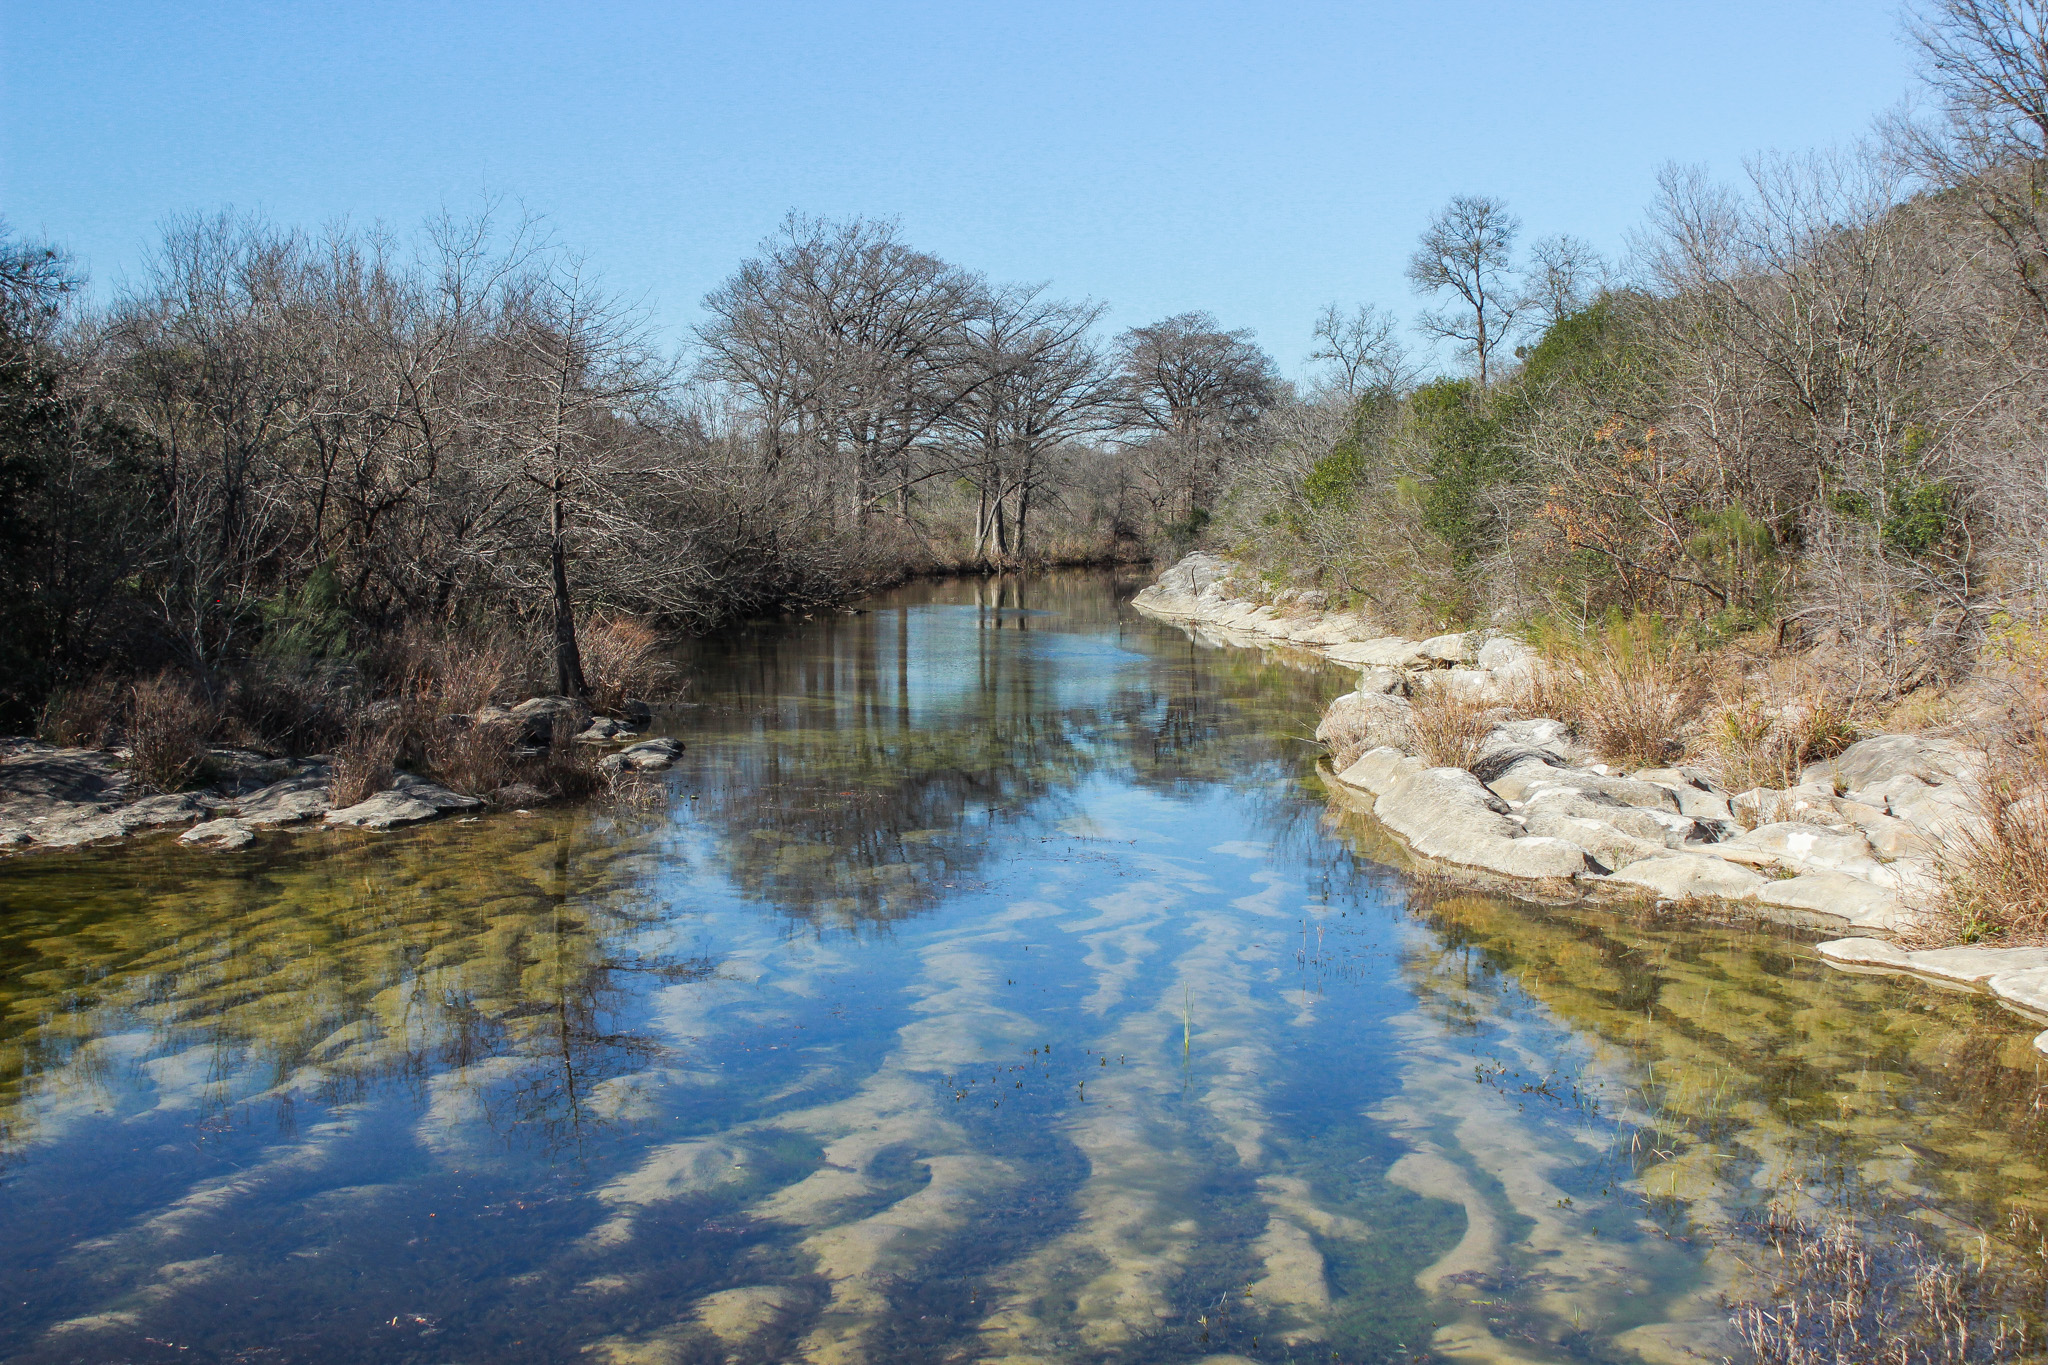
Photo of Onion Creek under Old San Antonio Road | February 2026
District’s Current Drought Status: Stage 3 Exceptional Drought
This February felt more like late spring than winter. KXAN reported, “There were 23 days in the month where the high temperature was above normal, topped by 88°F on the 28th. Only three days were below normal and two were at normal.” In the end, the month had an average temperature of 76.2°F, making it the warmest February on record (9.7° above normal).We also continued to receive below average rainfall.
Groundwater levels have stabilized as a result of recent precipitation, but the District continues to hover above Stage 4 Emergency Response Period. Even with the heavy rainfall last night, we expect the District will remain in Stage 3. It could take two weeks to see its full impact on groundwater levels.
Rainfall Recap
The Austin–Hill Country region recorded an average of 0.56 inches of rainfall in February, based on measurements from Camp Mabry and ABIA. This total is about 1.4 inches below the long-term February average (Figure 1).
Looking ahead, March typically brings around 2.9 inches of rainfall to the area. As of yesterday, the region has received 0.53 inches so far this month.
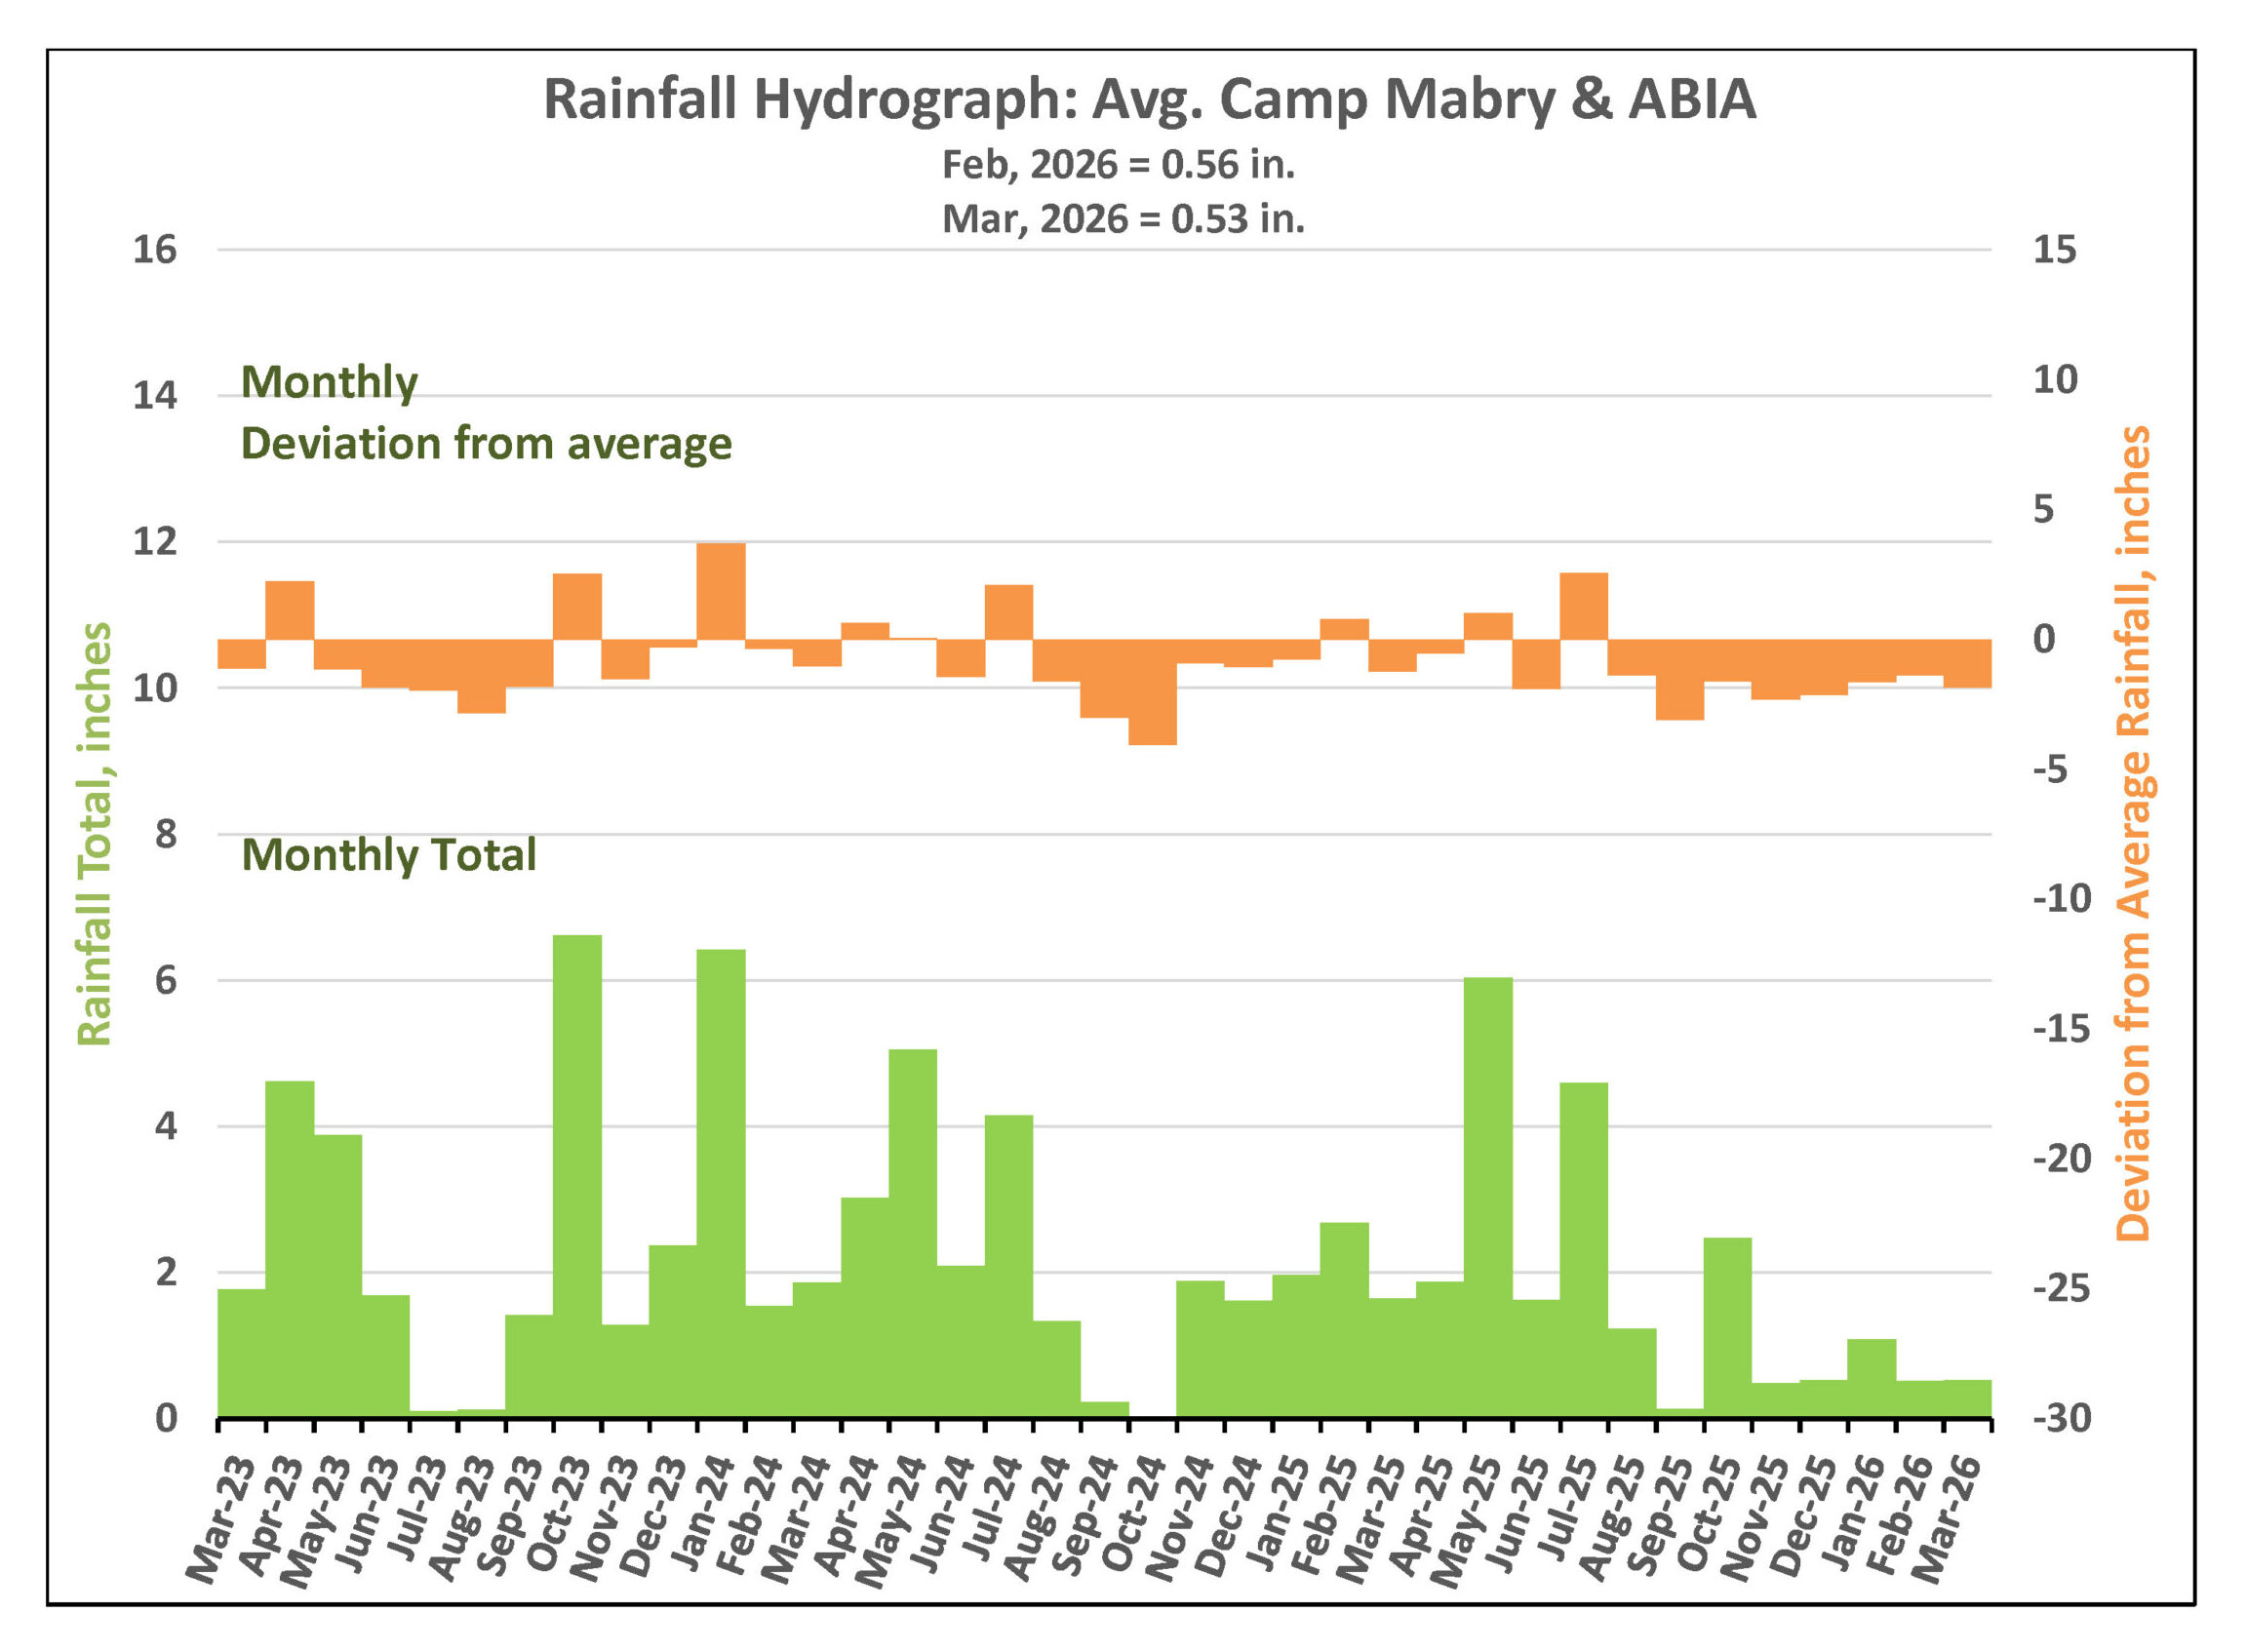
Figure 1. Monthly deviation from average and monthly total rainfall in District’s territory.
Drought Triggers and Status
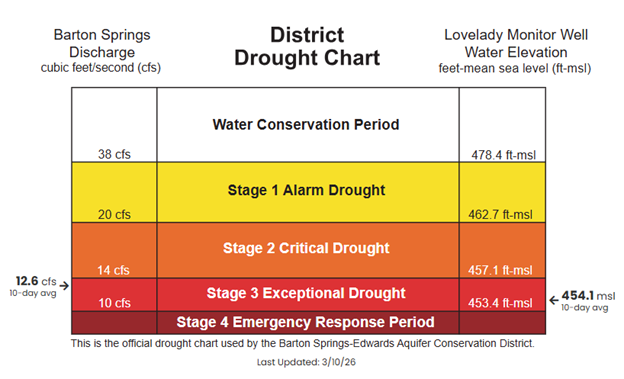
Figure 2. District Drought Chart as of 3/10/2026 displaying 10-day averages for springflow at Barton Springs (left) and groundwater levels at Lovelady monitor well (right)—both of which play a role in determining the District’s drought stage.
Barton Springs Flow
The 10-day average flow at Barton Springs was 12.6 cubic feet per second (cfs) as of yesterday – just 2.6 cfs above the Stage 4 Emergency Response threshold (Figure 3). The District obtained a manual flow measurement on March 10. The District has never reached Stage 4 Emergency Response, but without meaningful rainfall, Barton Springs flow could drop into that range in the next couple of months.
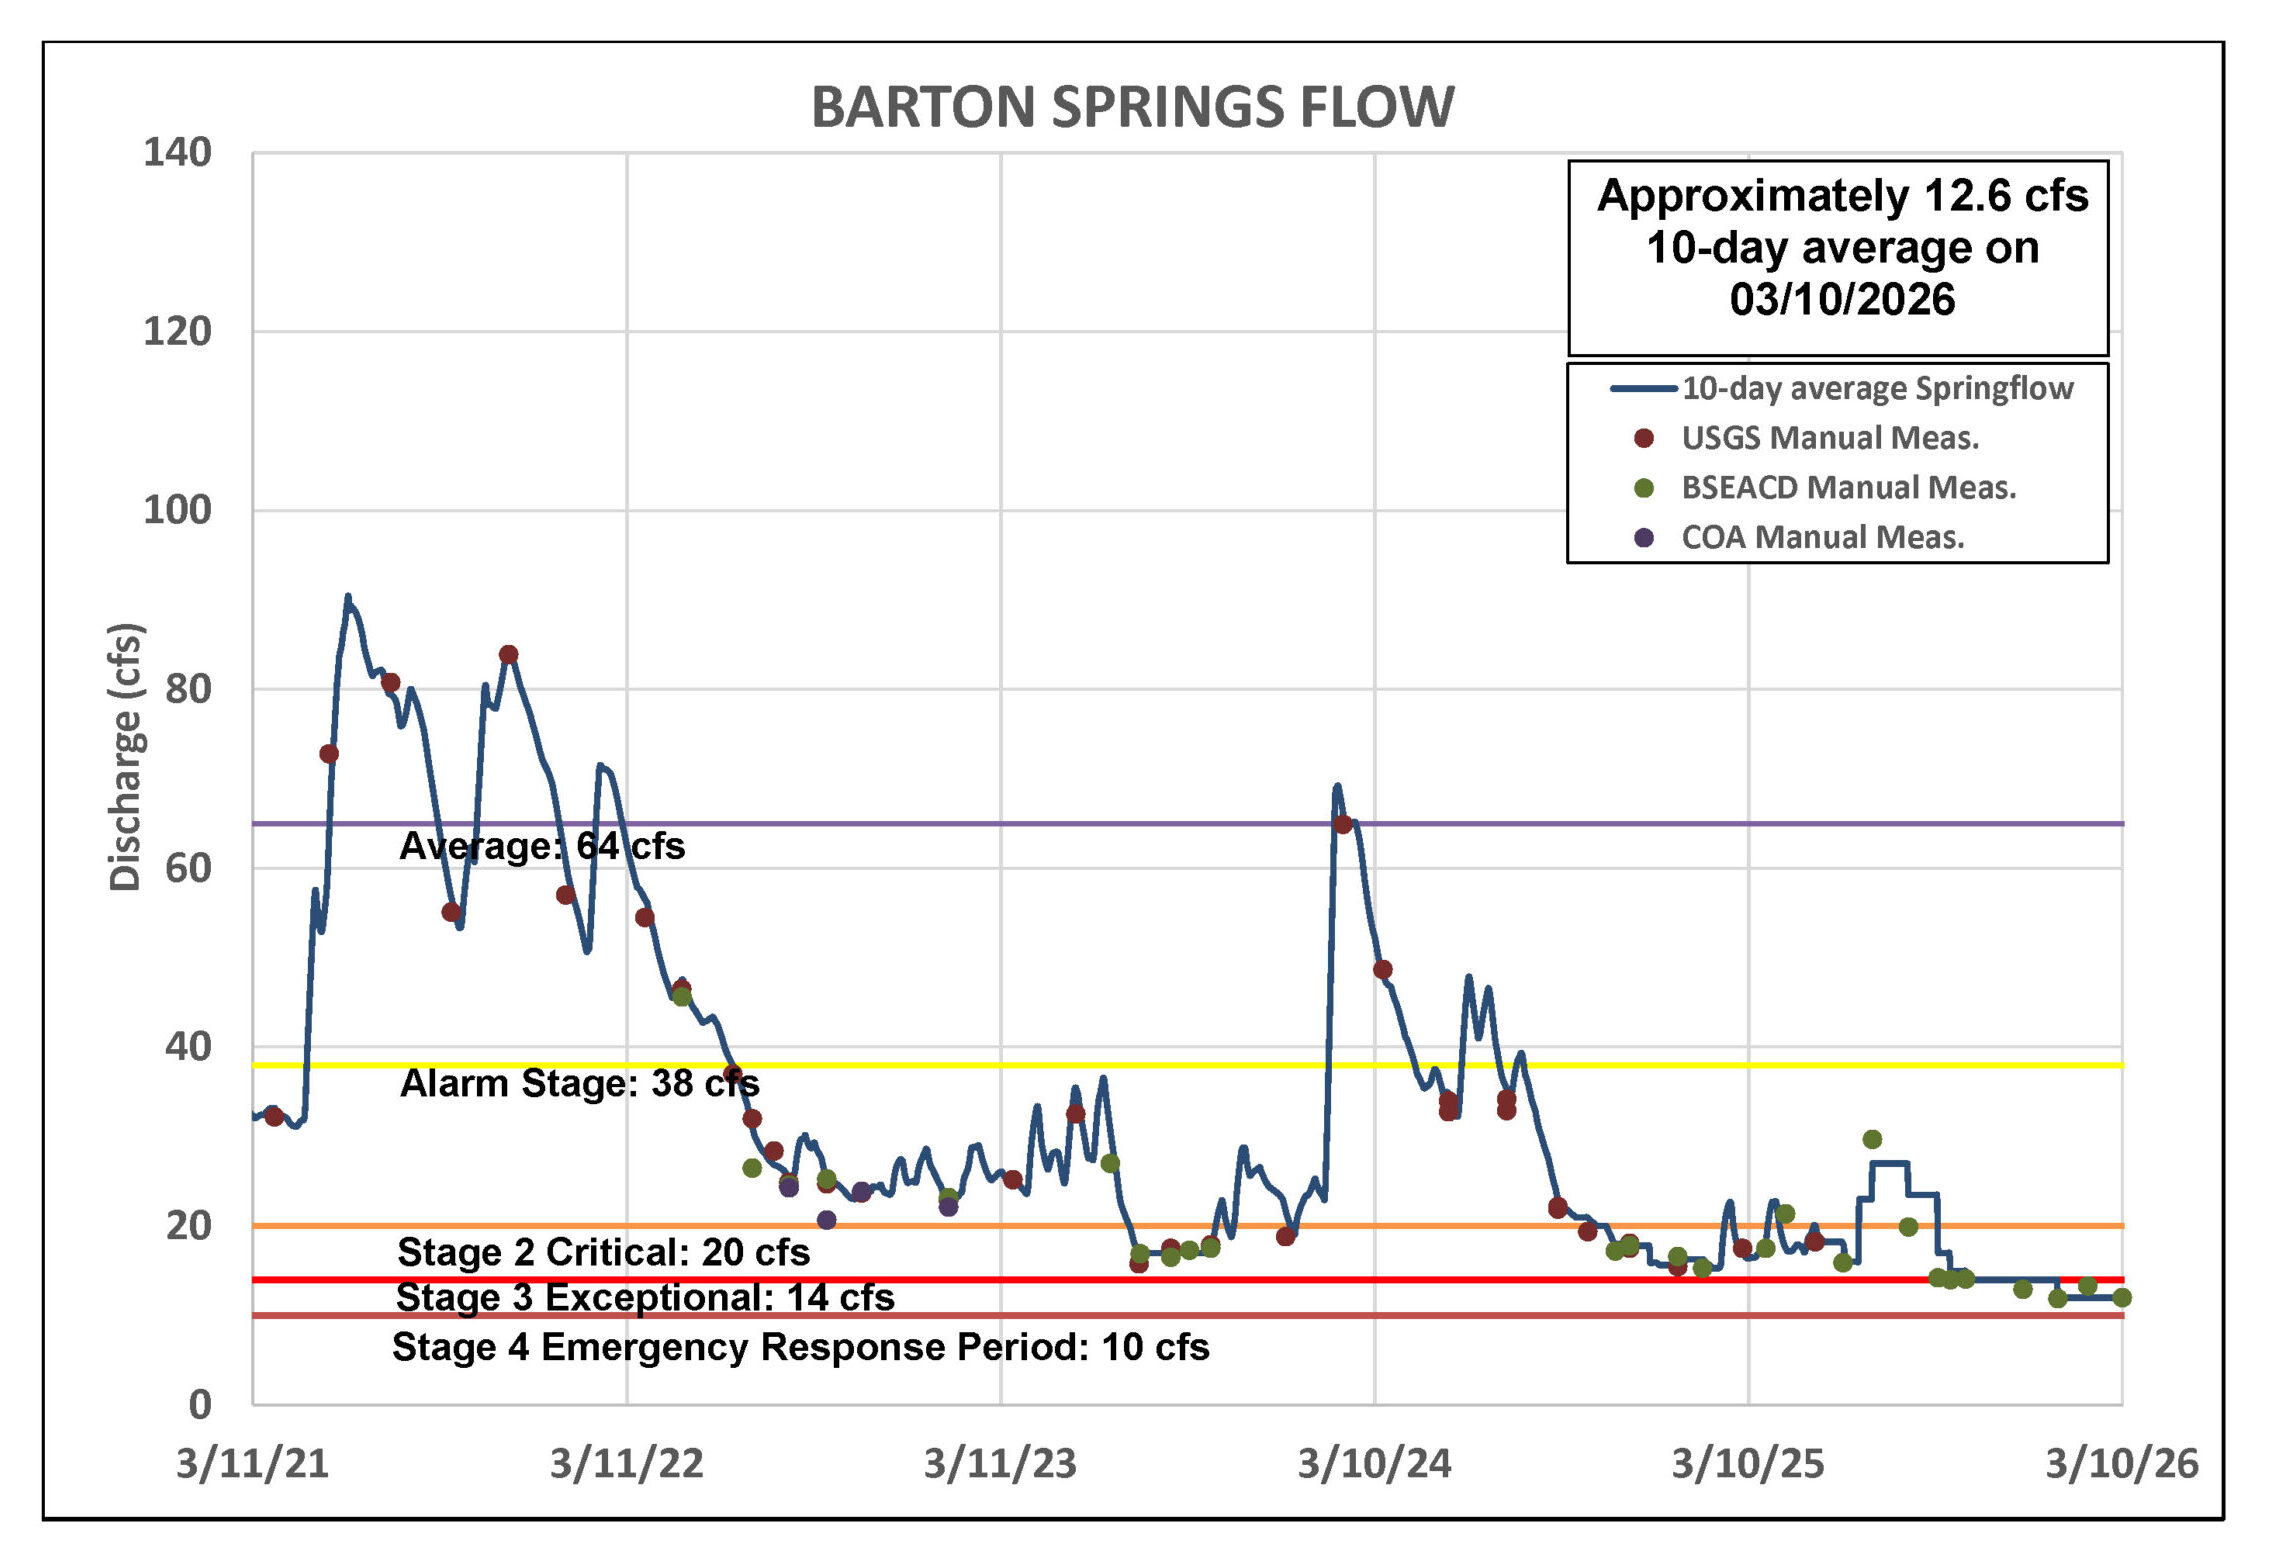
Figure 3. Barton Springs flow for the last five years.
*Note: Recent data for Barton Springs looks blockier than earlier, smoother records because it’s based on the average of two recent manual measurements, rather than continuous USGS gauge data.
Lovelady Monitor Well
As of March 10, the 10-day average water level at the Lovelady well is 454.1 feet above mean sea level (ft-msl). This falls within the Stage 3 Exceptional Drought range and is only 0.7 feet (8.4 inches) above the Stage 4 Emergency Response threshold (Figure 4).
Similar to conditions at Barton Springs, water levels could decline into Stage 4 Emergency Response if we don’t receive significant rainfall. The limited rain that’s fallen recently has essentially stabilized water levels and springflow, with little rise or decline, temporarily delaying a potential transition into Stage 4.
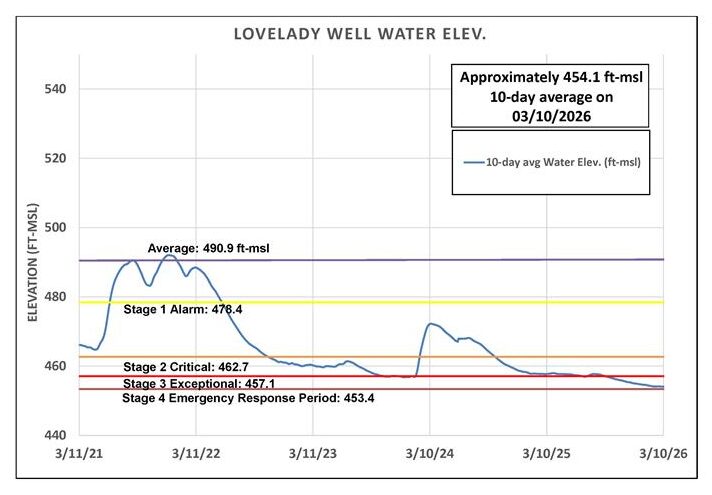
Figure 4. Lovelady groundwater level over the last five years.
Trinity Aquifer
The Lowe-Coronado Middle Trinity monitor well continues to show a steep decline in groundwater levels, reaching new lows (Figure 5). This downward trend mirrors conditions across the region, including in the overlying Upper Trinity Aquifer.
As of March 10, the 10-day average flow at Jacob’s Well Spring (JWS) is 0 cubic feet per second (cfs) and has been reporting 0 flow since November 2025. The Blanco River at Wimberley is maintaining flows between 5-6 cfs.
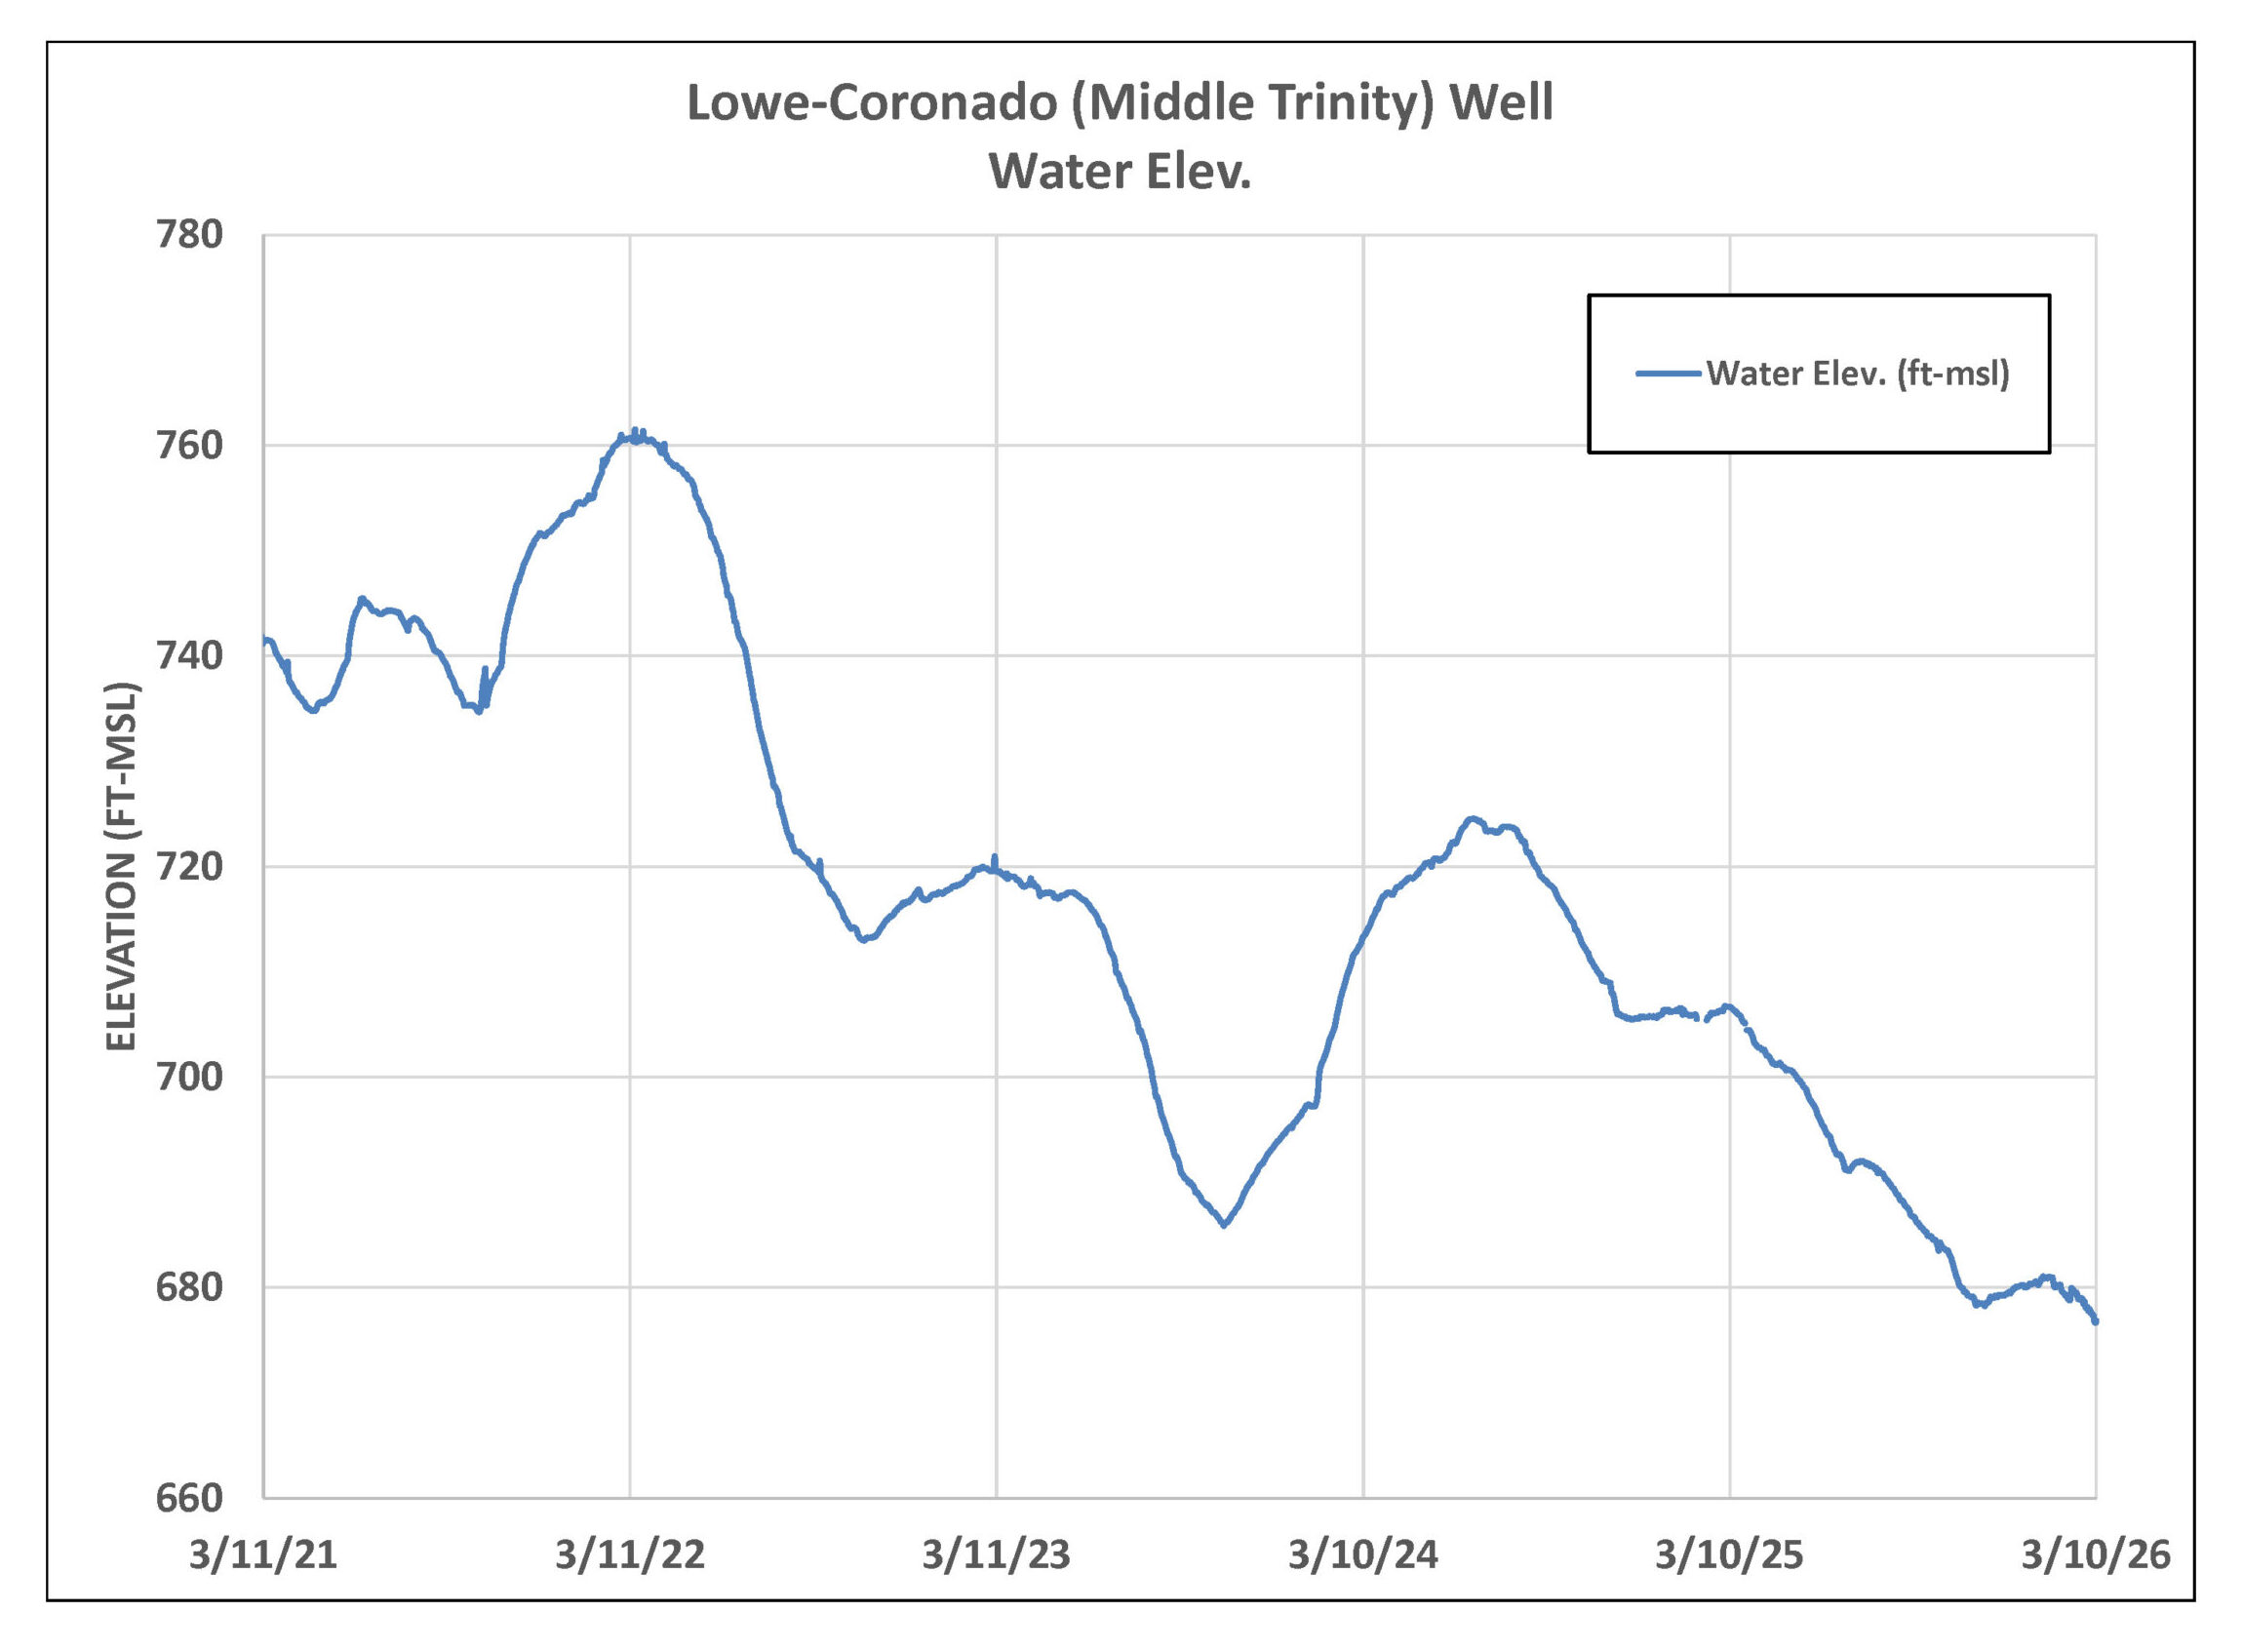
Figure 5. Lowe-Coronado (Middle Trinity) monitor well water-level elevation.
Outlook
Climate Prediction Center’s outlook for March – May forecasts above average temperatures with equal chances for above or below average rainfall. We’ve had a rainy start to March, and we will see if we meet average rainfall for the month.
Figure 6. NOAA seasonal precipitation outlook for March – May 2026.