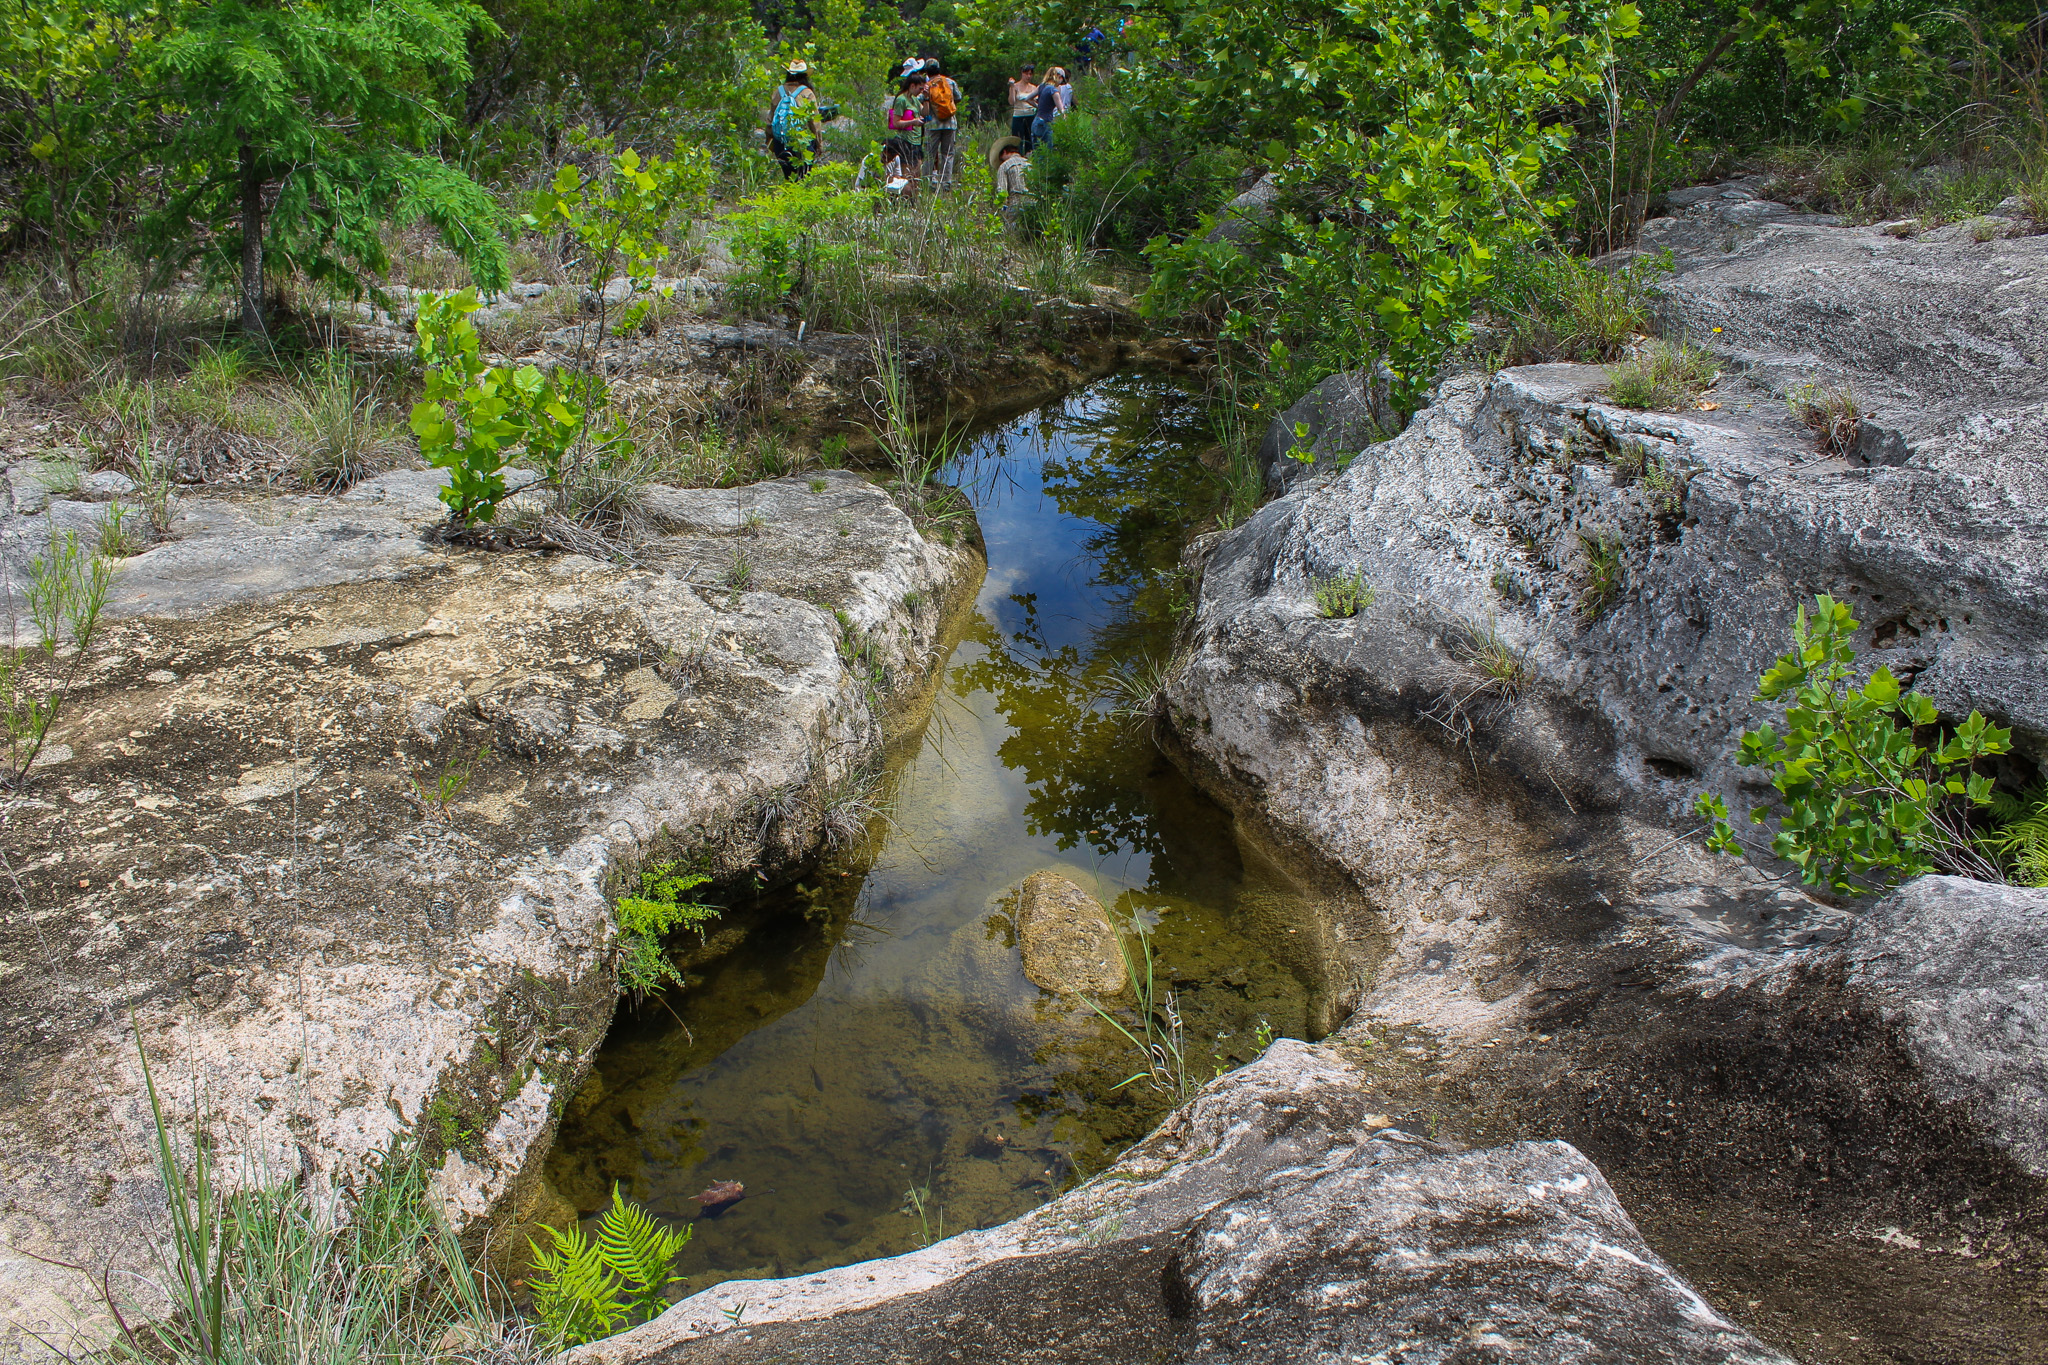
A Trinity Aquifer spring along Hamilton Creek in Travis County.
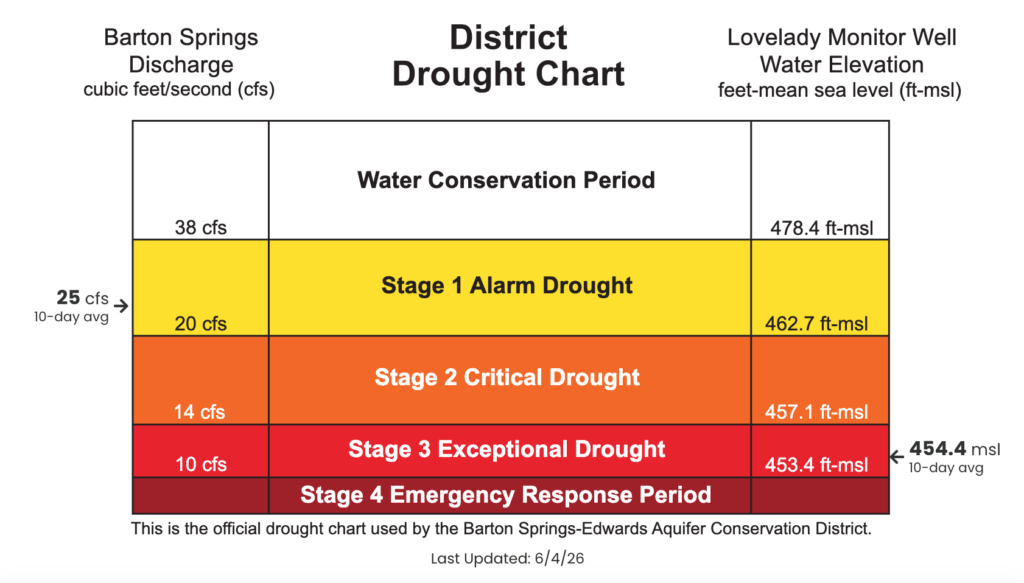
District’s Current Drought Status: Stage 3 Exceptional Drought
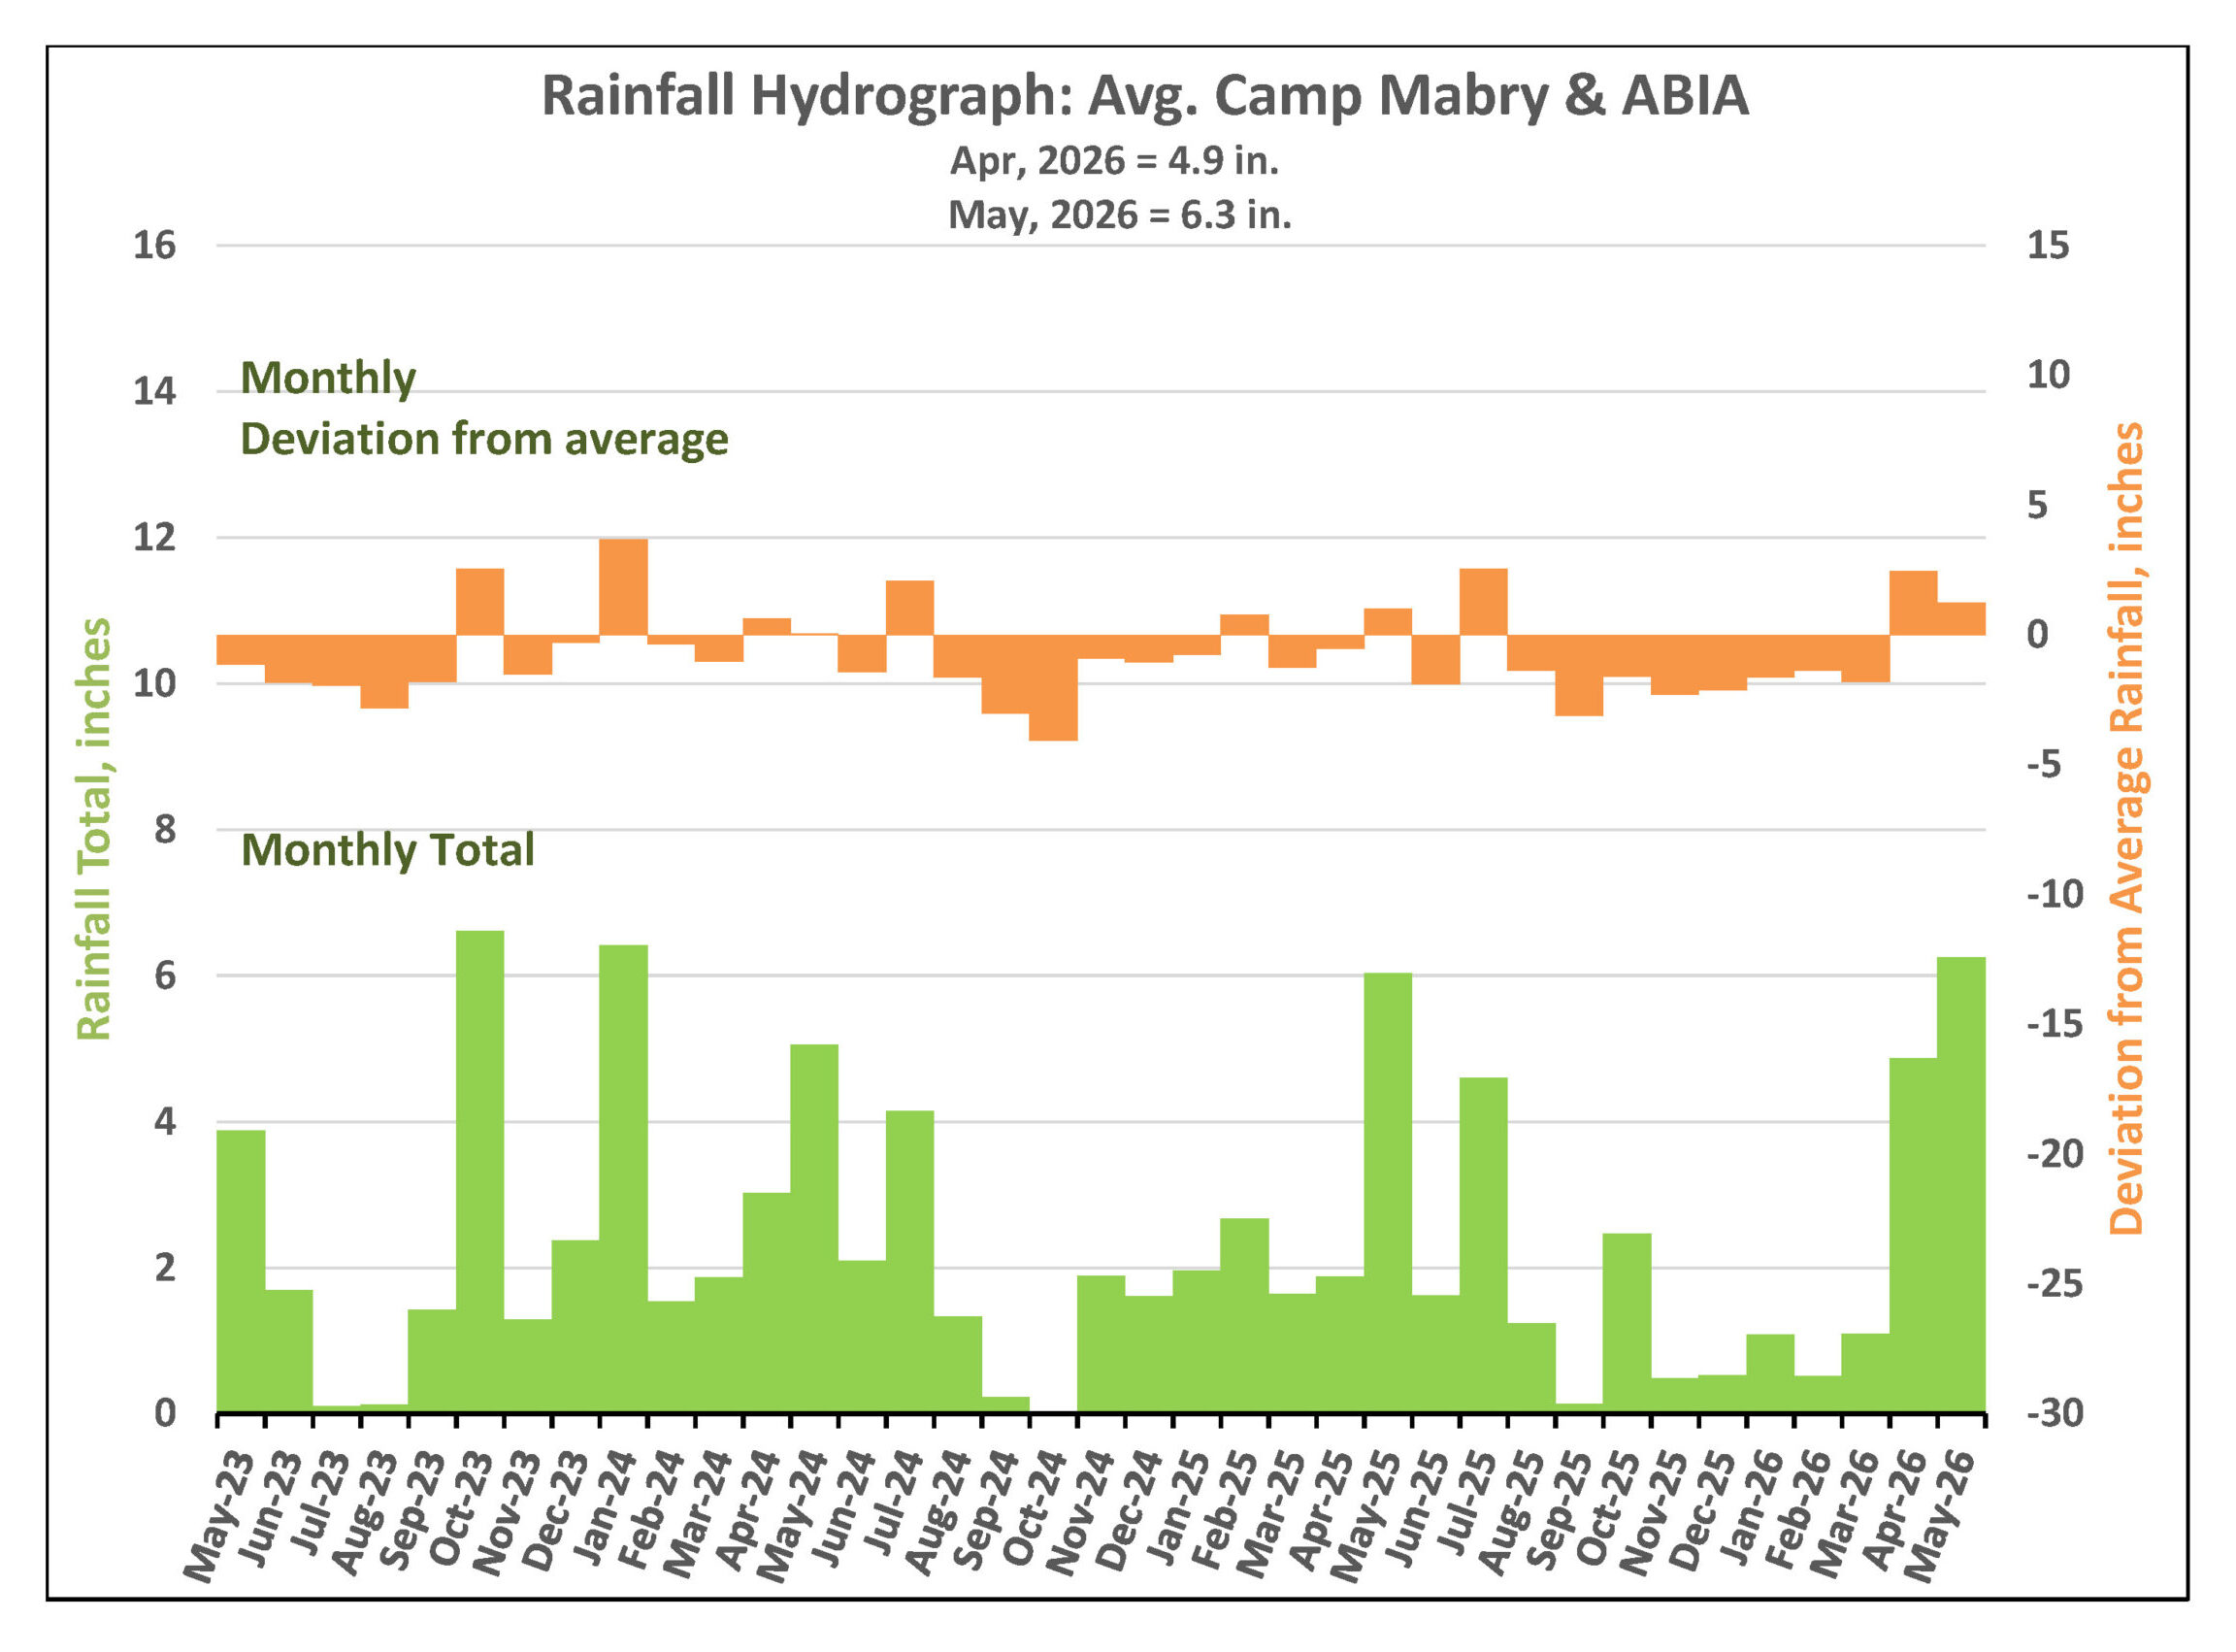
Rainfall Recap
Total May rainfall averaged approximately 6.3 inches across the Camp Mabry and Austin-Bergstrom International Airport (ABIA) weather stations—about 1.2 inches above the long-term monthly average (Figure 1). This marks the second consecutive month of above-average rainfall for the region.
June is typically the third-wettest month of the year in Central Texas with an average rainfall of about 3.7 inches. As of June 4, the area has already received approximately 1.4 inches of rain. Following the above-average precipitation in April and May, soil moisture conditions are favorable for aquifer recharge from additional precipitation. As a result, area creeks, springs, and groundwater levels are beginning to show modest but encouraging signs of recovery.
Barton Springs Flow
As of June 4, the 10-day average discharge at Barton Springs is 25 cubic feet per second (cfs). Springflow responded positively to recent rainfall, increasing from 17 cfs on May 12 to a peak of 29 cfs, according to the U.S. Geological Survey (USGS) gauge (Figure 3).
Barton Springs flow is currently above the 20 cfs threshold associated with Stage 1 Alarm Drought conditions. Because the District’s drought stage is determined using both Barton Springs flow and groundwater levels in the Lovelady monitor well, the District will remain in Stage 3 Exceptional Drought. For the District to declare a less severe drought stage, both indicators must improve beyond their respective drought-stage thresholds.
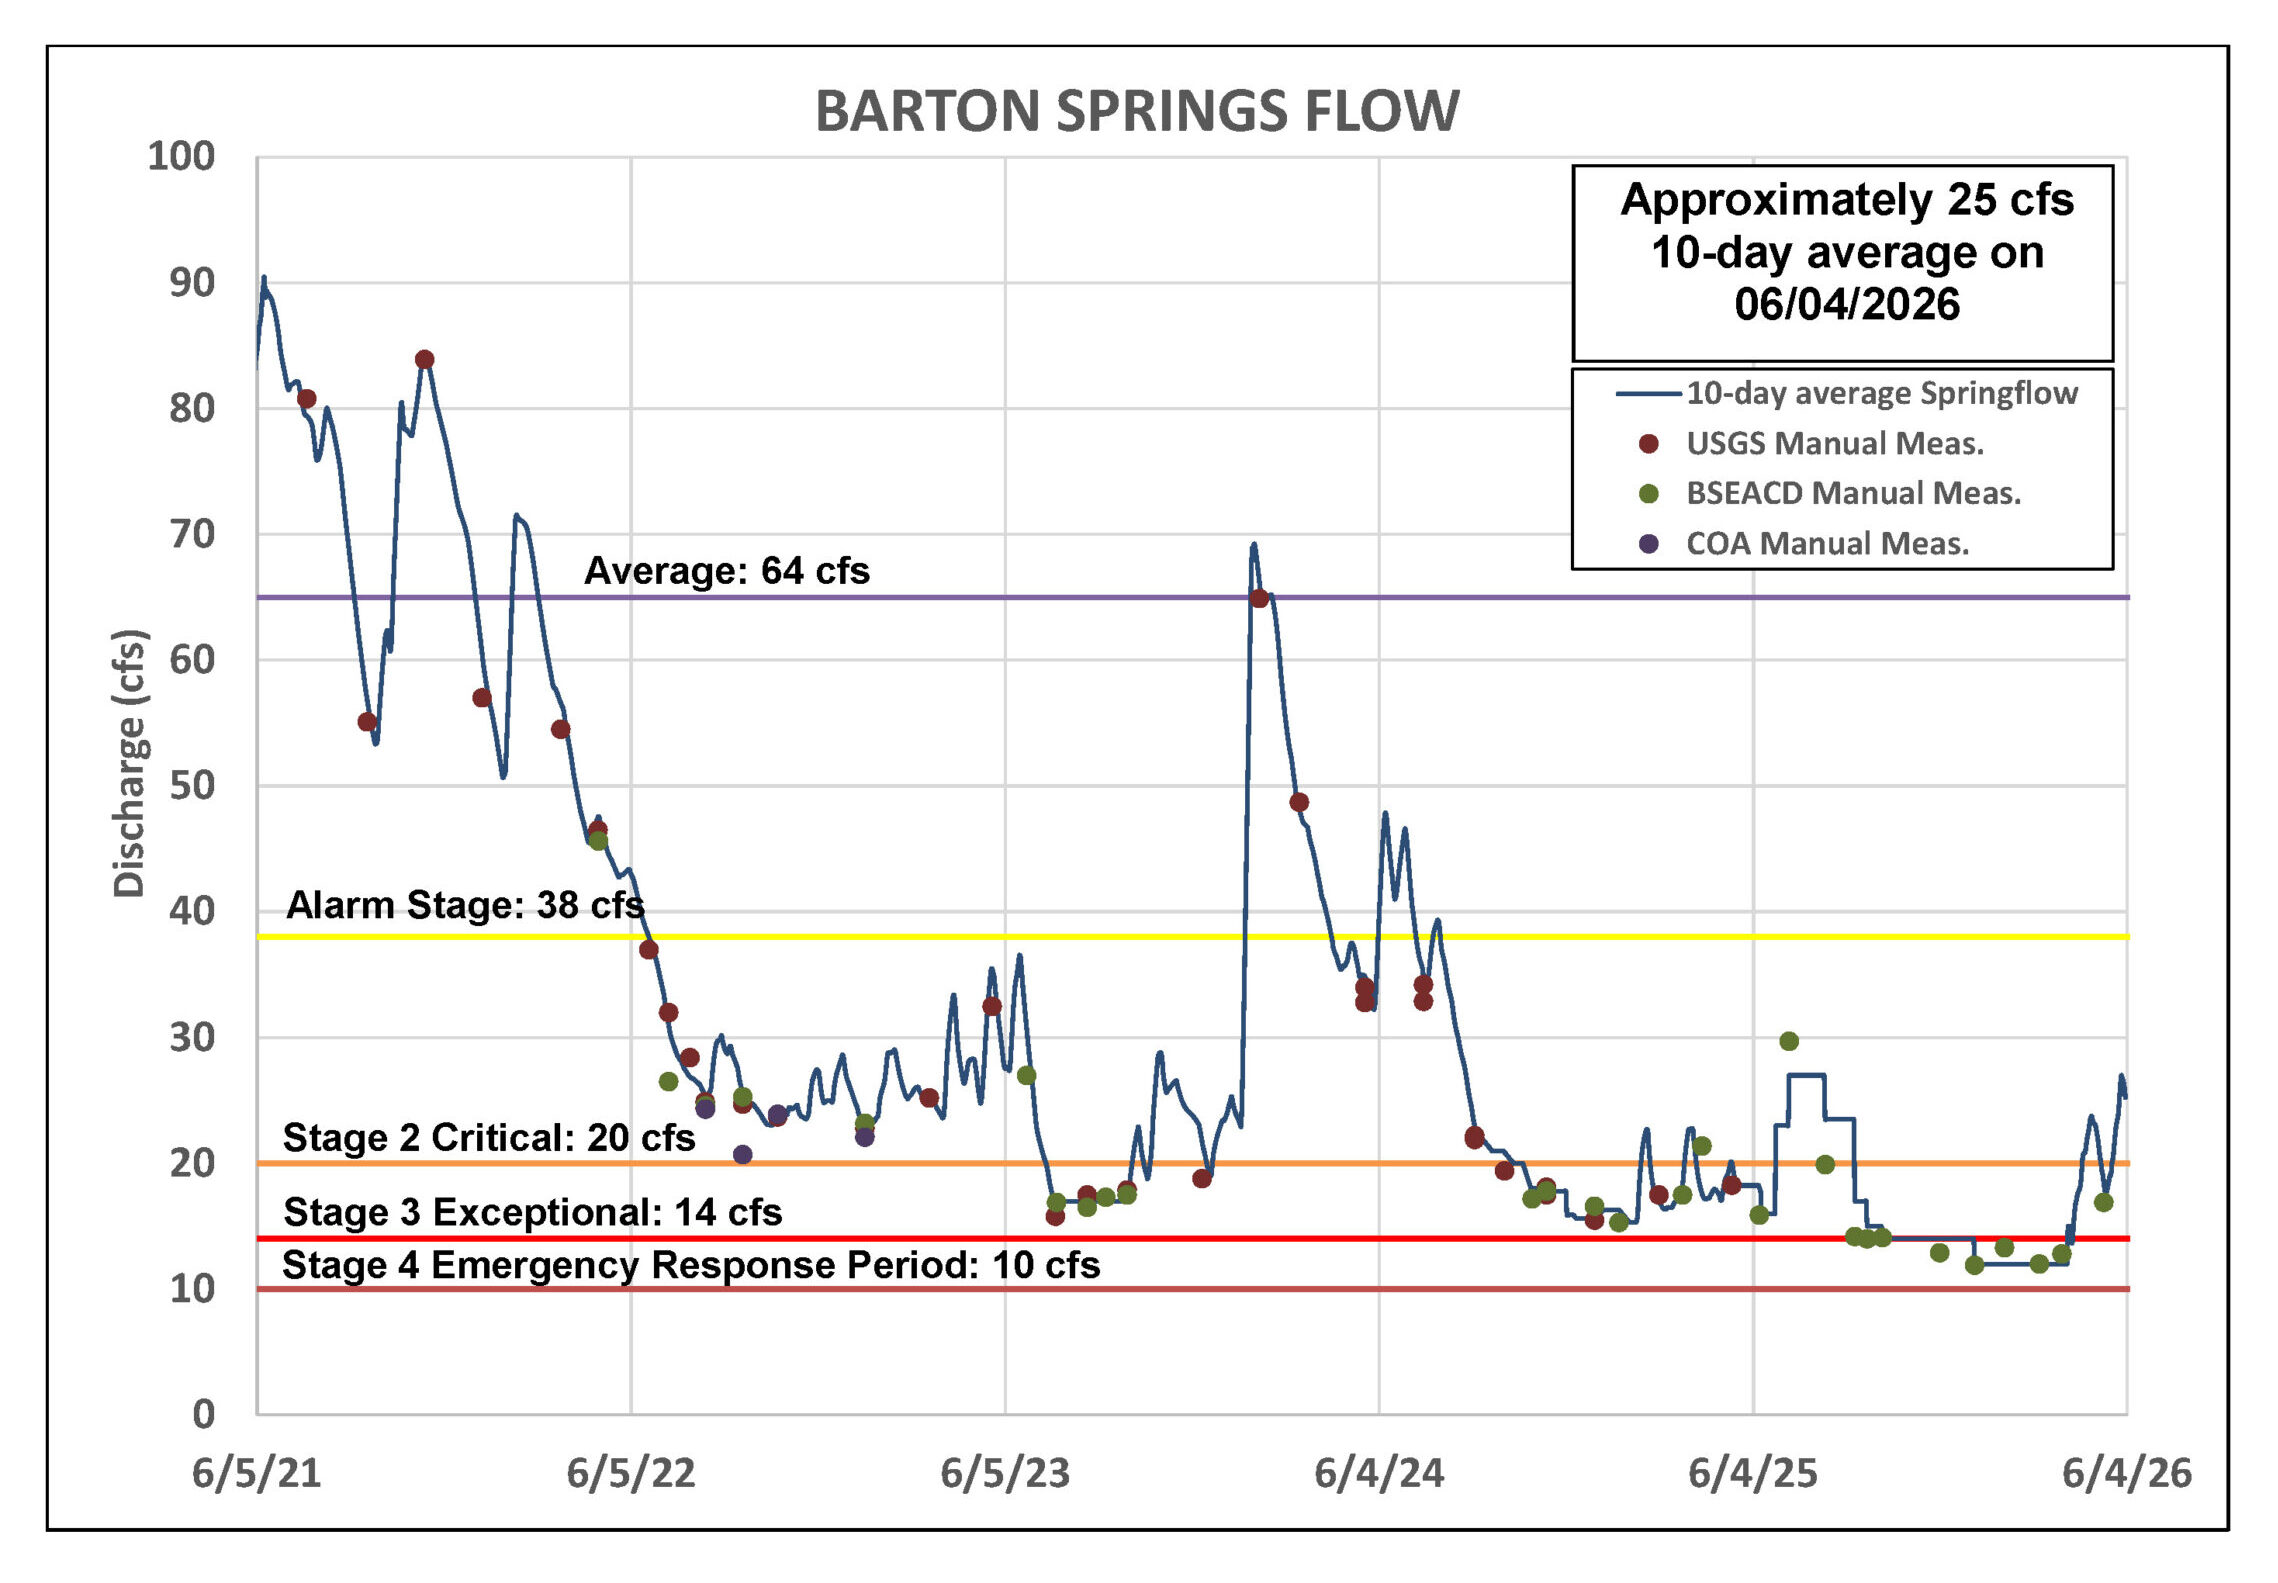
*Note: Recent data for Barton Springs looks blockier than earlier, smoother records because it’s based on the average of two recent manual measurements, rather than continuous USGS gauge data.
Lovelady Monitor Well
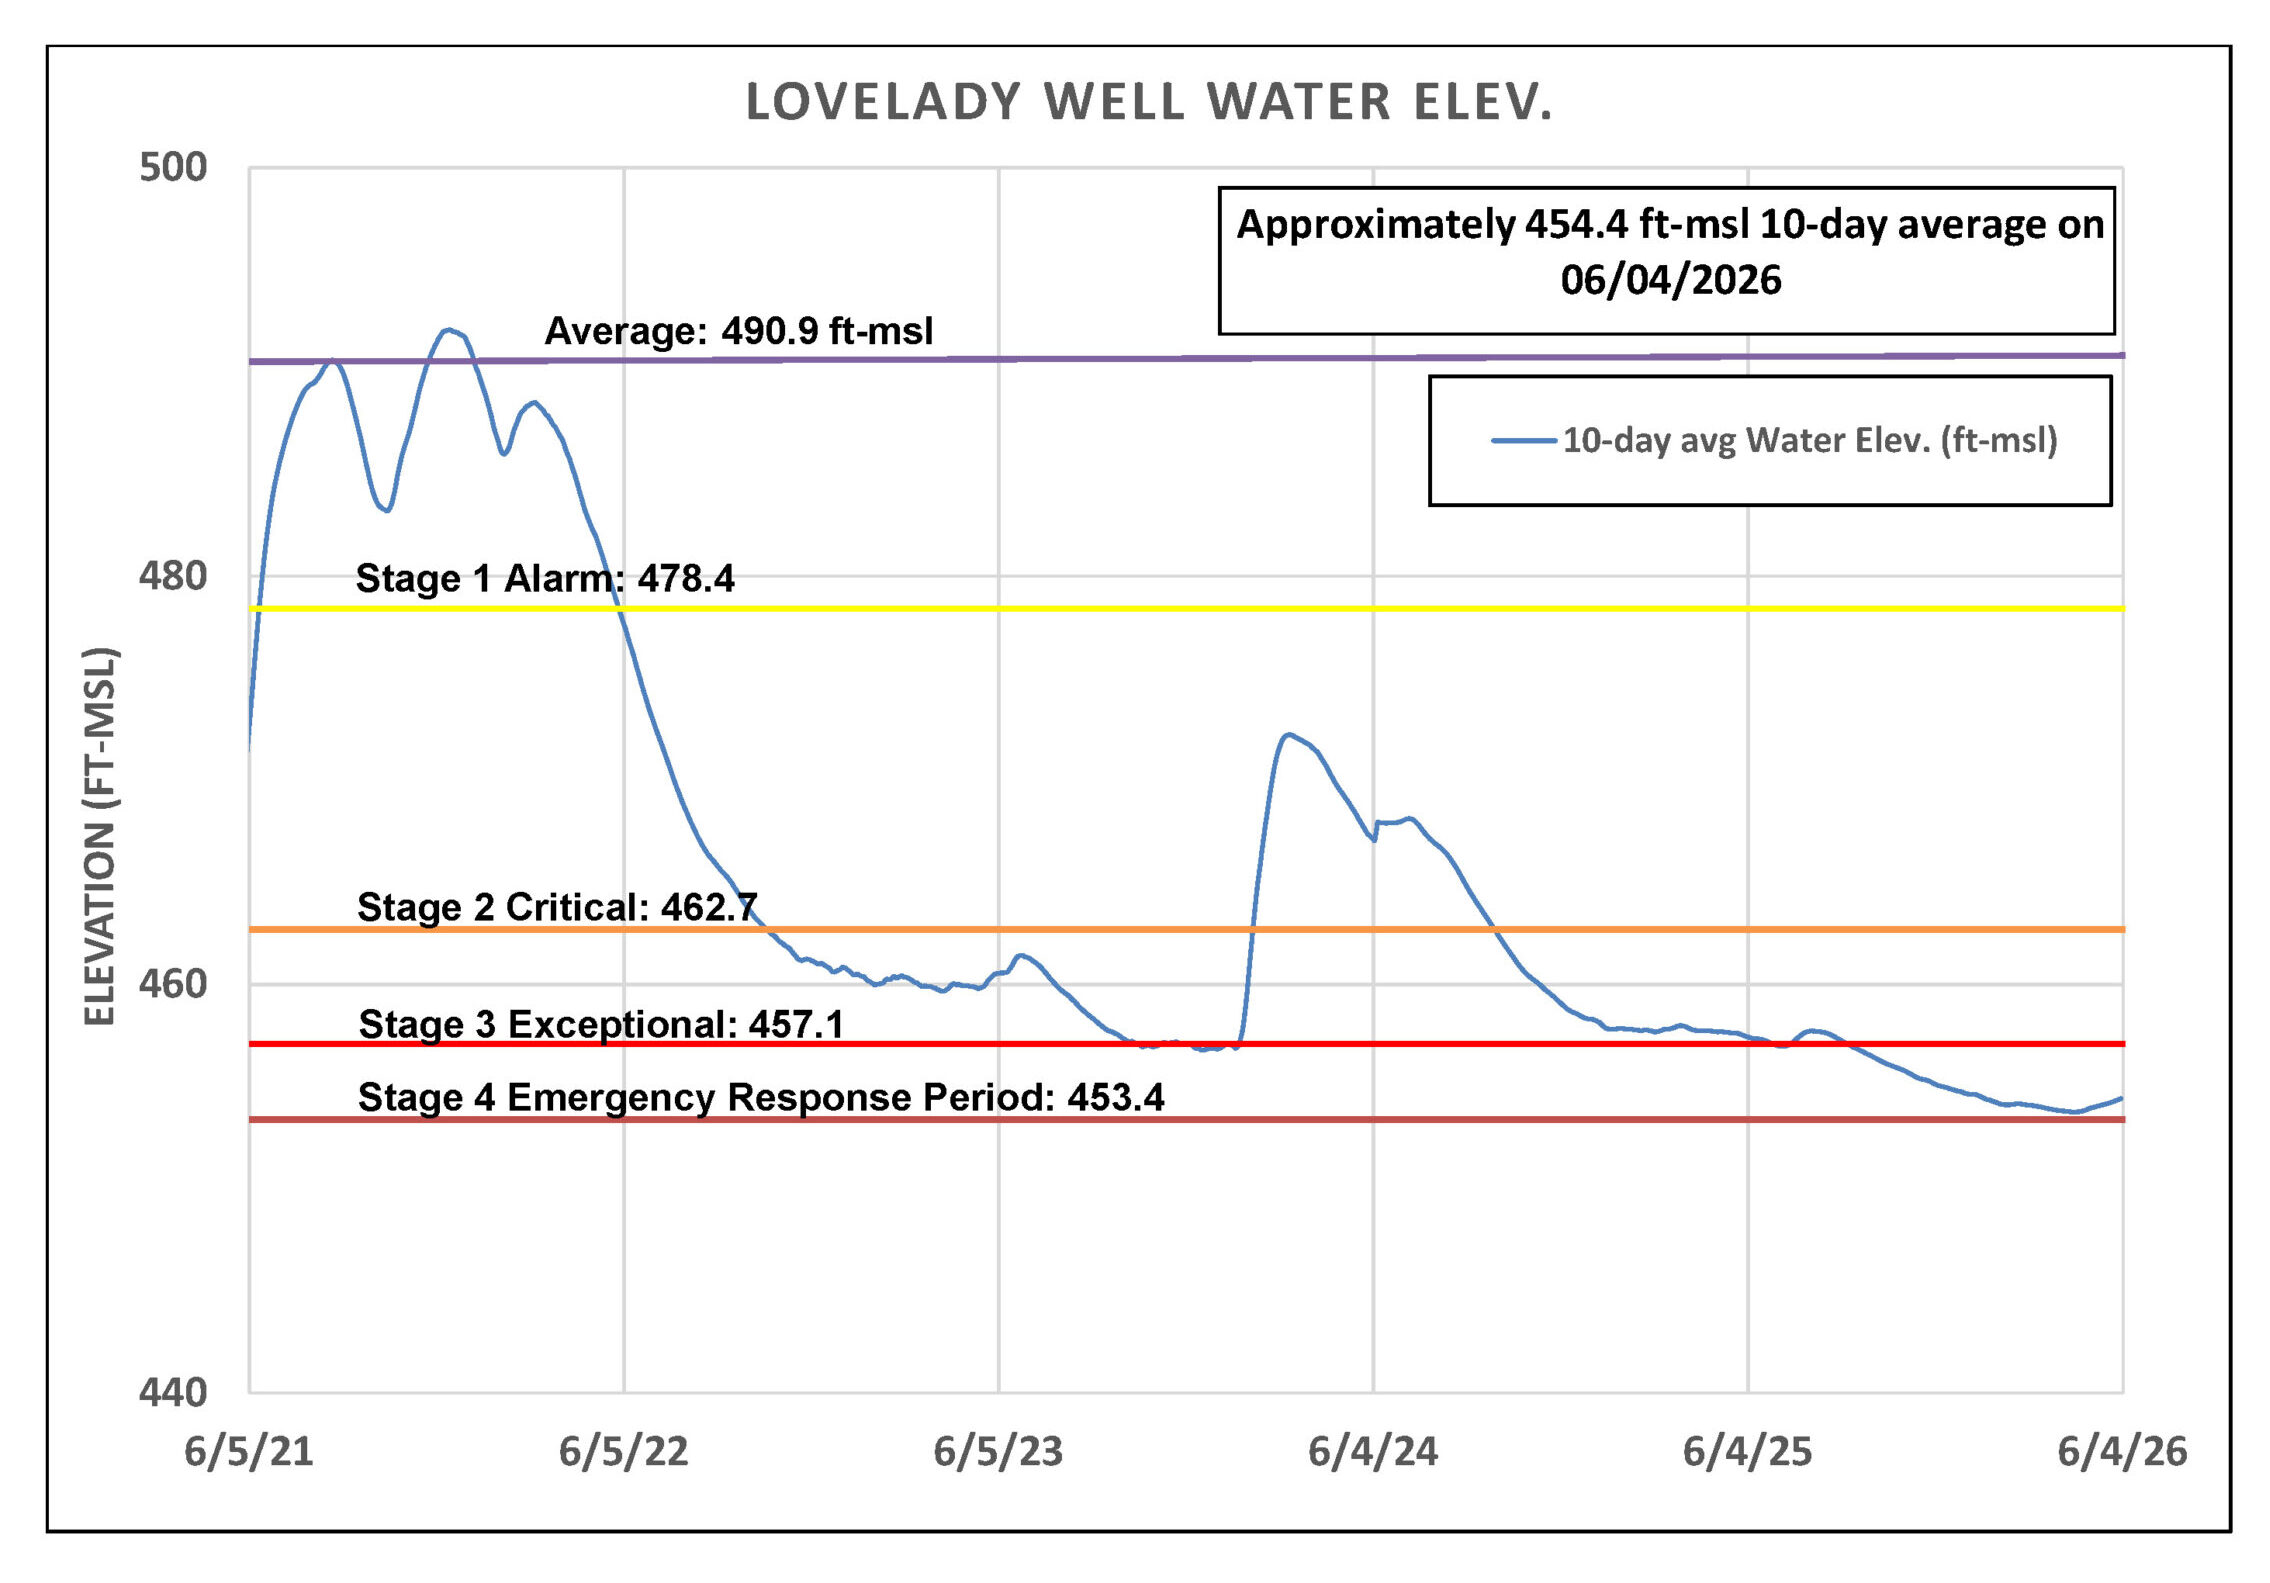
Improvements are also being observed in groundwater levels. As of June 4, the 10-day average water level at the Lovelady monitor well is 454.4 feet above mean sea level (ft-msl), up from 453.9 ft-msl on May 4—a rise of approximately half a foot over the past month (Figure 4).
While this continued increase is an encouraging sign, groundwater levels remain within Stage 3 Exceptional Drought conditions. To move out of Stage 3, the Lovelady water level would need to raise an additional 2.7 feet. Even so, the recent recovery in groundwater levels, combined with increased springflow at Barton Springs, has helped reduce the immediate risk of entering Stage 4 Emergency Response restrictions as the region moves into the typically hotter and drier summer months.
Trinity Aquifer
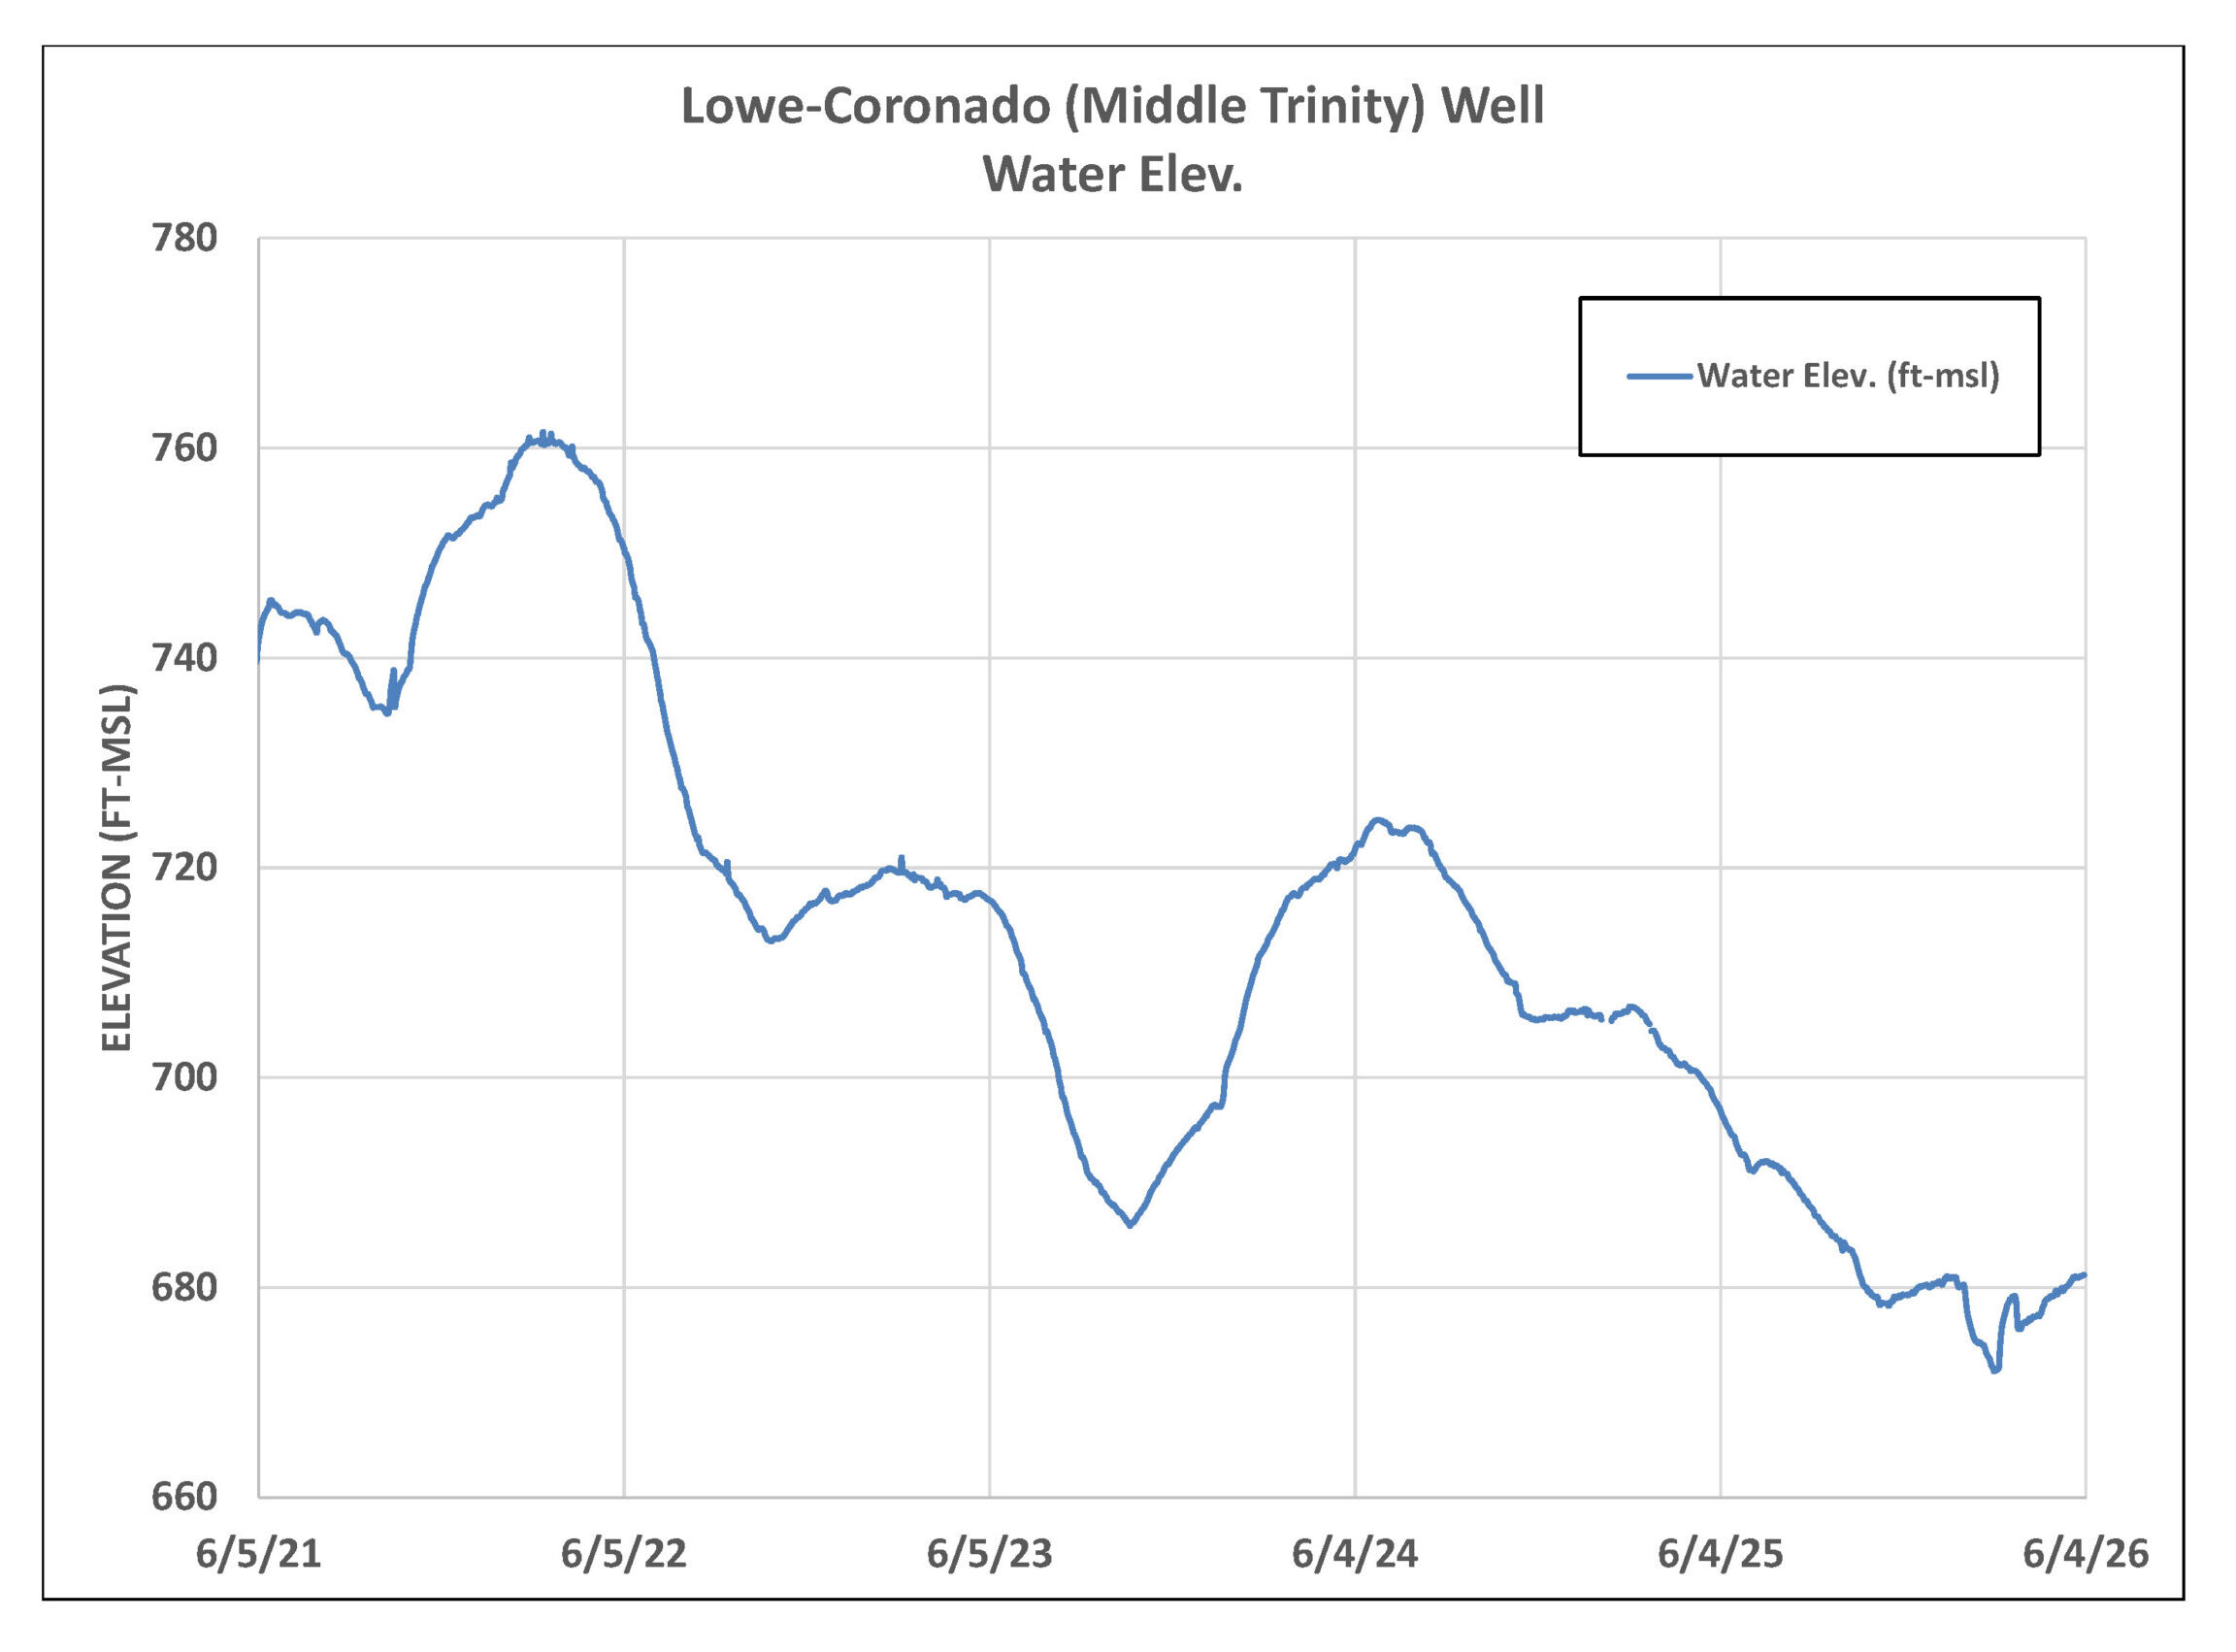
Groundwater levels in the Trinity Aquifer are also showing signs of improvement following recent rainfall. Water levels in the Lowe-Coronado Middle Trinity monitor well continue to rise (Figure 5), a positive trend that is likewise being observed in portions of the Upper Trinity Aquifer. While encouraging, additional rainfall is needed to sustain these gains and support longer-term recovery.
Jacobs Well Spring also responded to recent precipitation. As of June 4, the spring’s 10-day average flow is 0.4 cfs following approximately one inch of rainfall near Wimberley on June 2, springflow briefly increased to a peak of 2.3 cfs before beginning to recede.
Meanwhile, the Blanco River at Wimberley has maintained baseflows between 4 and 7cfs. While streamflows remain relatively low, rainfall has provided modest but measurable benefits to both springflow and river conditions within the watershed.
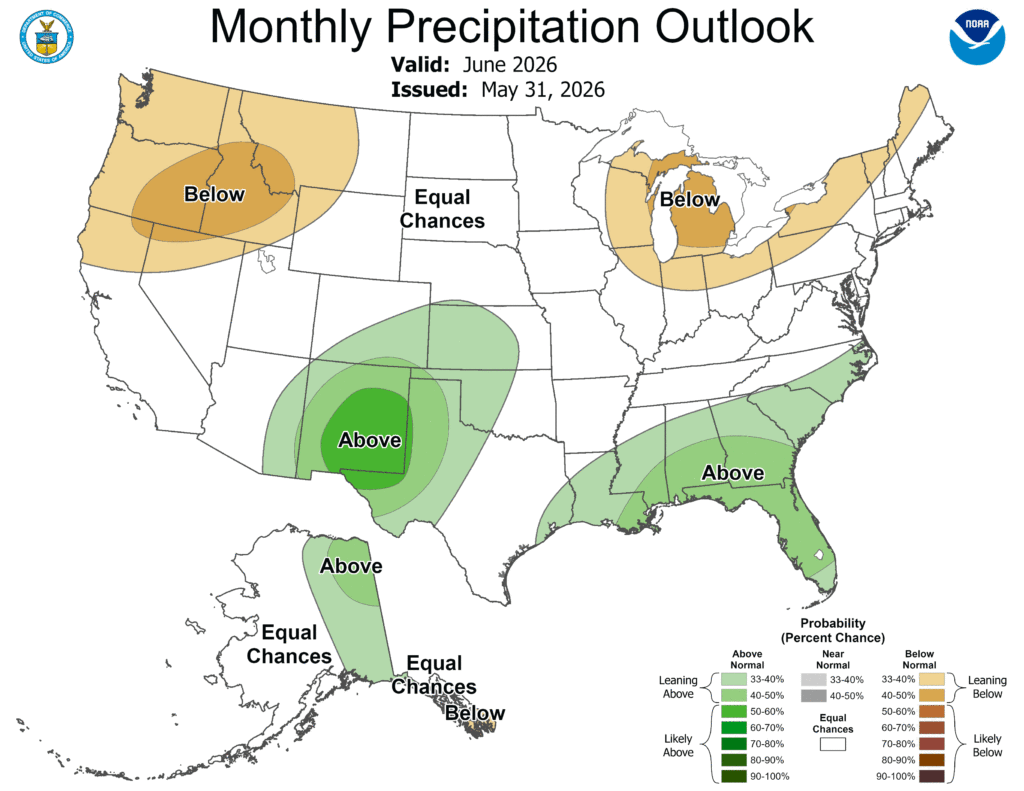
Outlook
The Climate Prediction Center 30-day forecast shows Central Texas has equal chances for above or below average rainfall and temperatures through June. The area’s historical monthly average rainfall for June is 3.5 inches.