
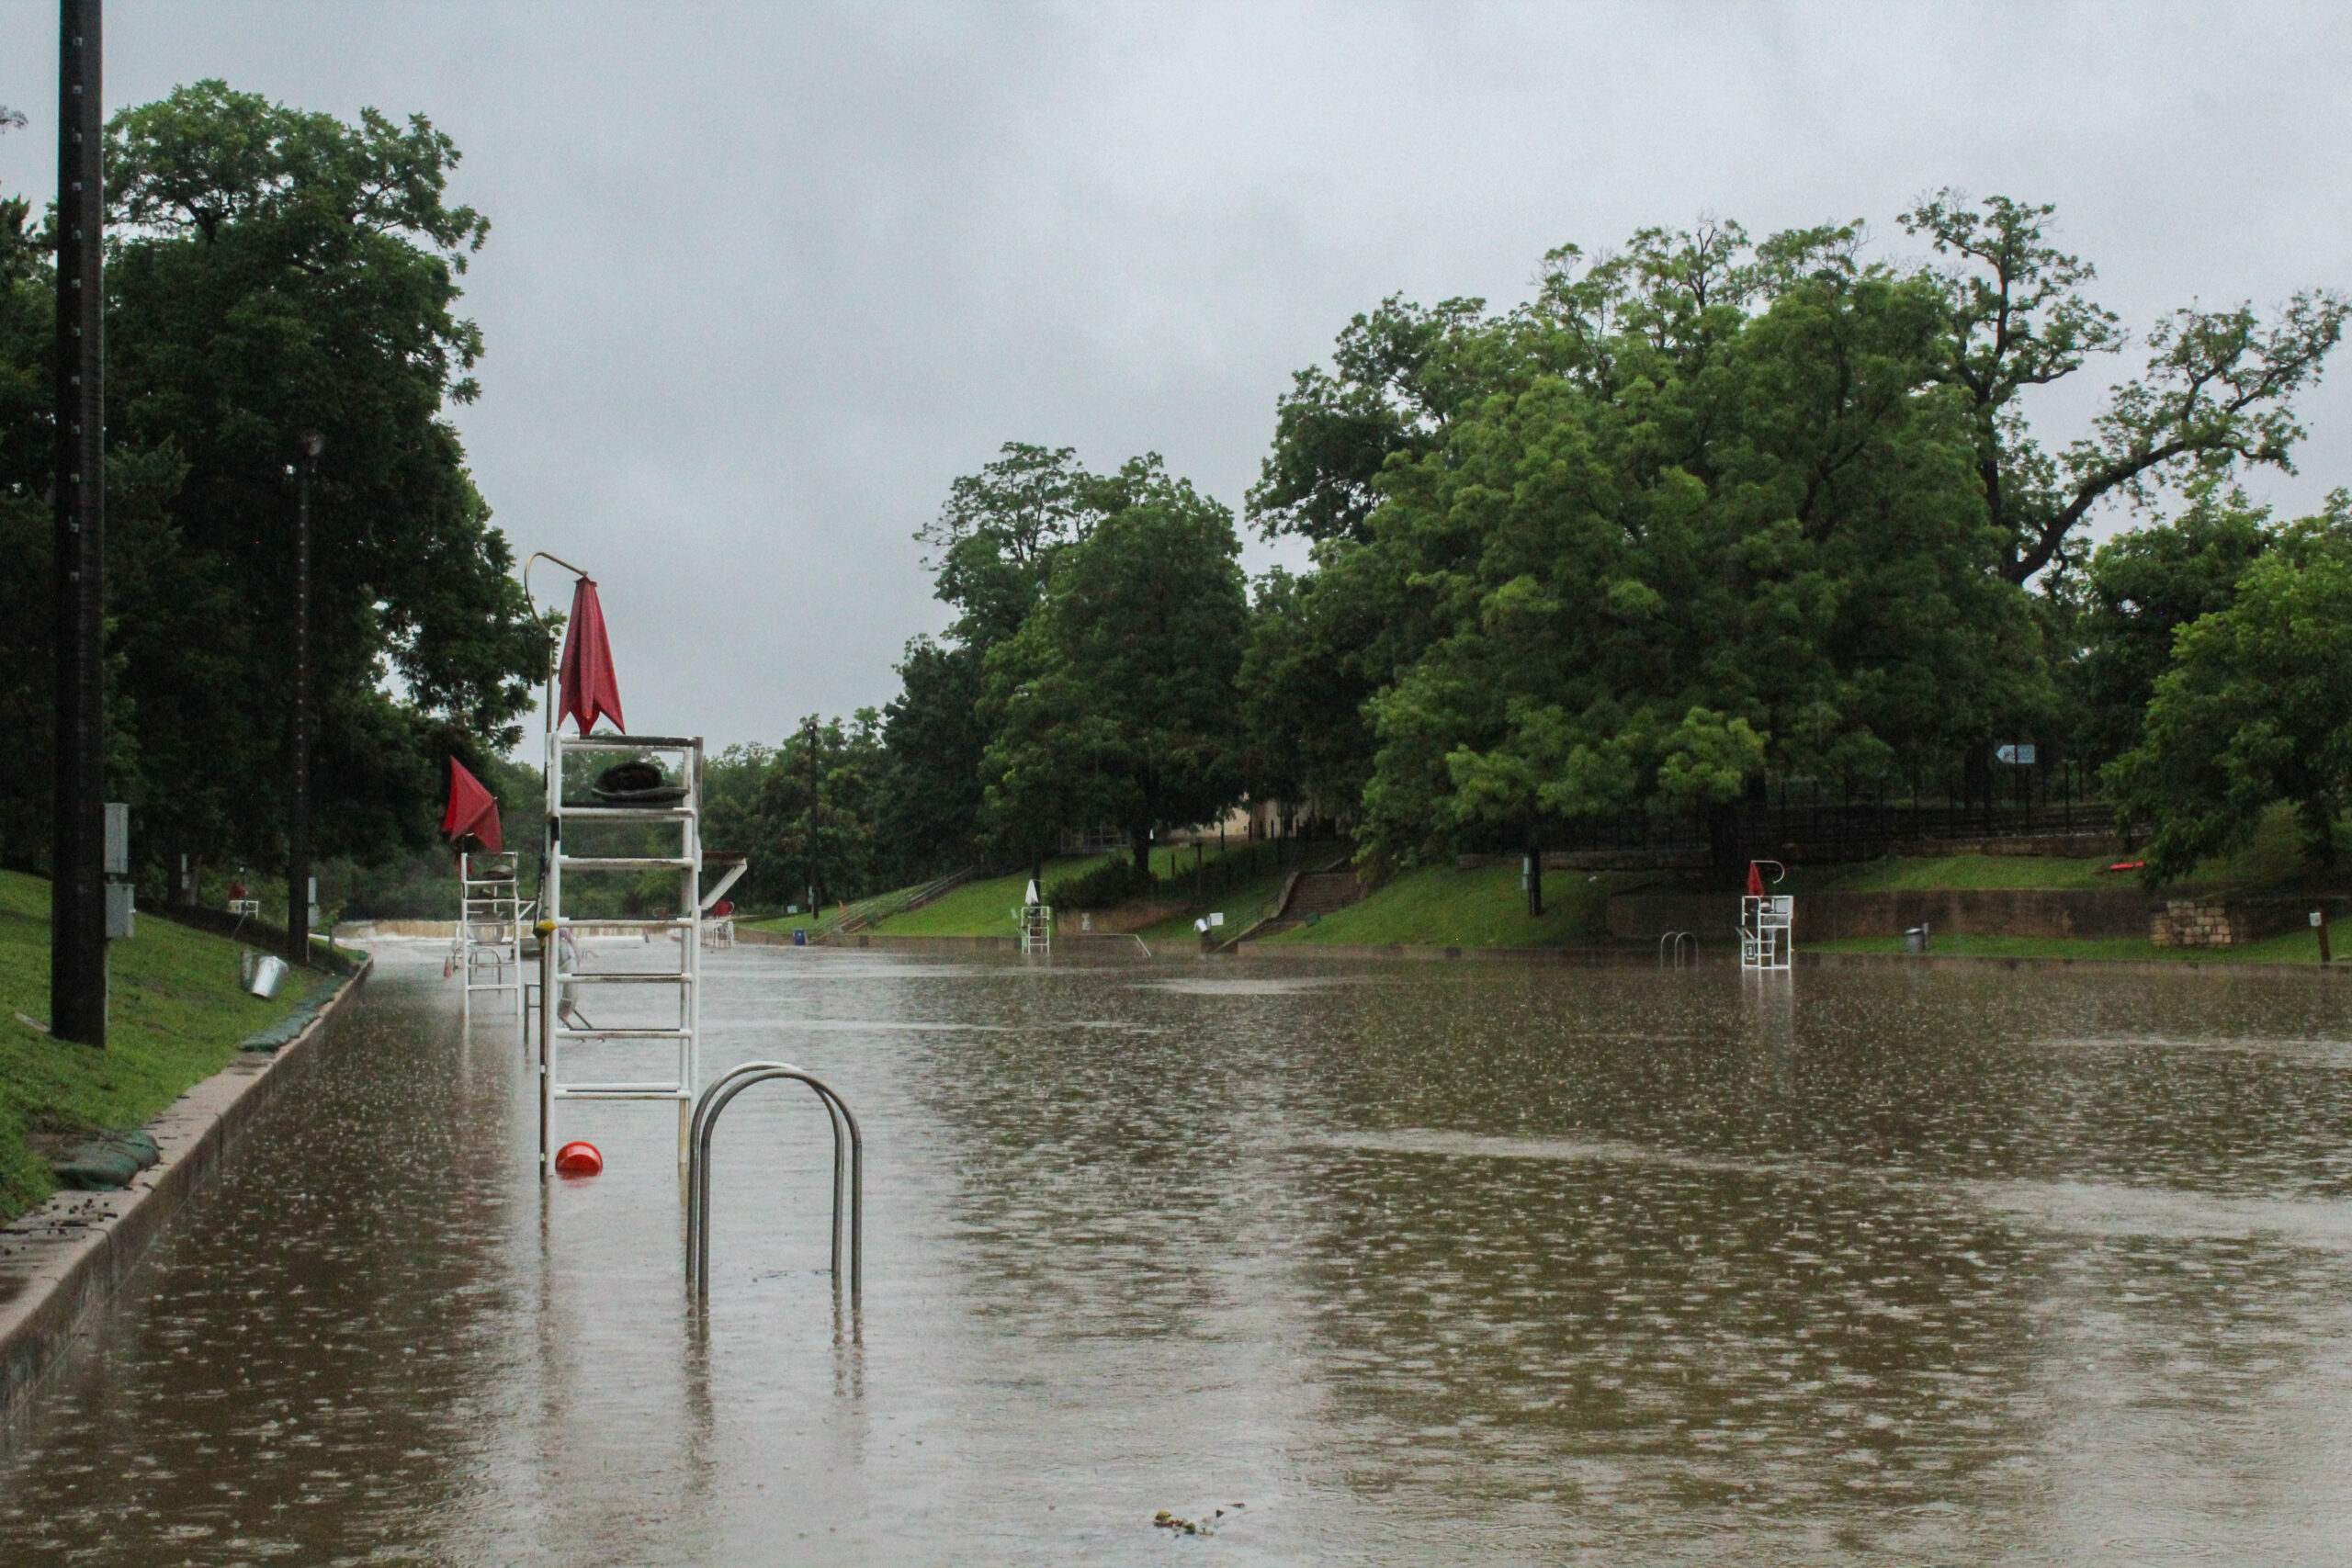
This photo was taken at 8:00 AM on June 15 at Barton Springs Pool after heavy overnight rainfall.
District’s Current Drought Status: Stage 3 Exceptional Drought
June brought 6.1 inches of rainfall, marking the third consecutive month of above-average rainfall across the region, following 4.9 inches in April, and 6.3 inches in May (Figure 1). This is a remarkable turnaround considering that, before April, we had endured eight straight months of below-average rainfall.
On July 3, water levels at the Lovelady monitor well improved from the Stage 3 Exceptional Drought to Stage 2 Critical Drought, joining Barton Springs flow in recovering above the Stage 3 thresholds. While these gains are certainly encouraging, they remain fragile. Barton Springs flow has already begun to recede, and water levels at the Lovelady monitor well appear to have peaked. As Central Texas enters its hottest and driest months, conditions could quickly reverse these recent improvements.
District staff will continue closely monitoring groundwater levels and springflow throughout July before considering any further changes to the District’s drought stage. By allowing current trends to develop over the coming weeks, the District can make a more informed and confident decision regarding drought status in August.
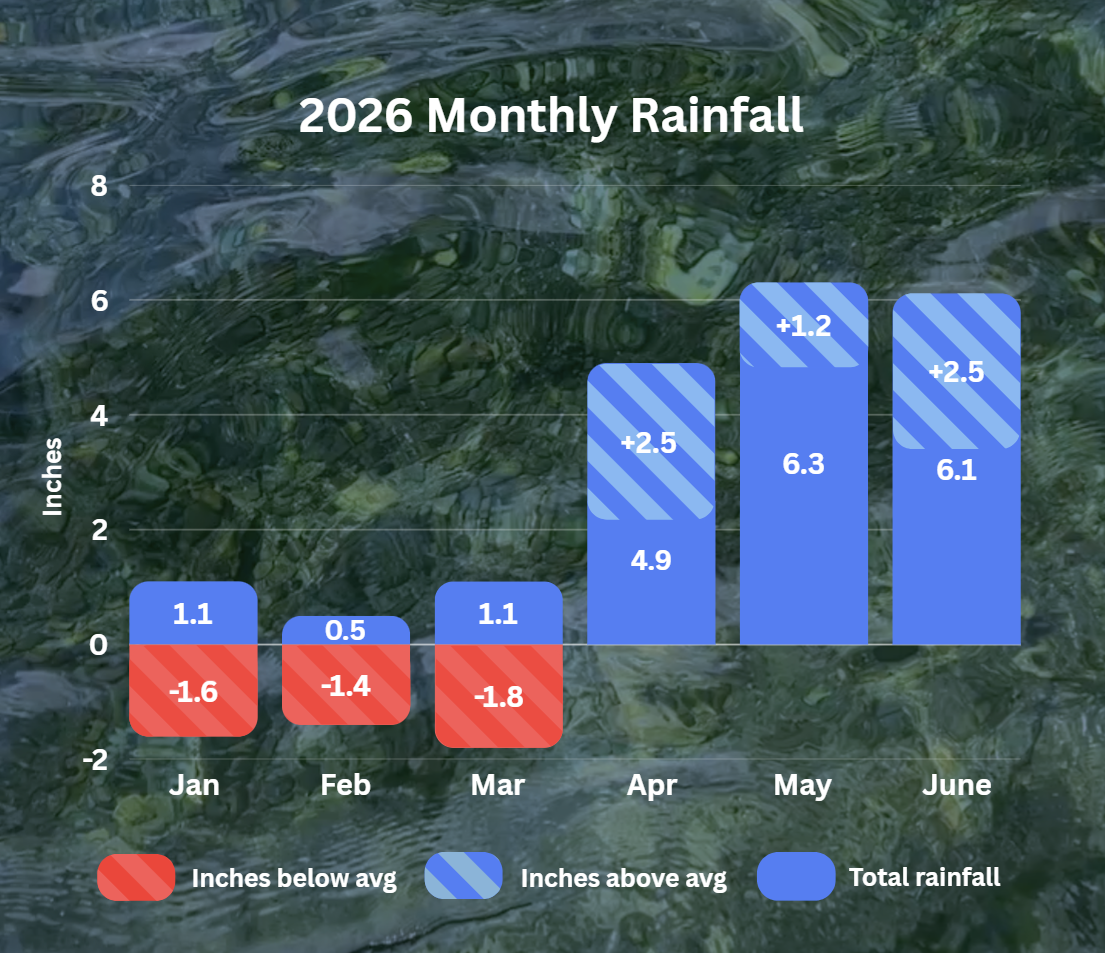
Figure 1. Monthly deviation from average and monthly total rainfall in District’s territory for January through June of 2026.
Rainfall RecapTotal June rainfall averaged approximately 6.1 inches across the Camp Mabry and Austin-Bergstrom International Airport (ABIA) weather stations – about 2.5 inches above the long-term monthly average (Figure 2).
June is typically the third wettest month of the year in Central Texas, averaging about 3.7 inches of rainfall. Following the above-average rainfall in April and May, conditions were favorable for aquifer recharge. As a result, the widespread 3 to 4 inches of rain that fell on June 15 generated significant flow in creeks crossing the recharge zone, allowing additional recharge to the aquifer.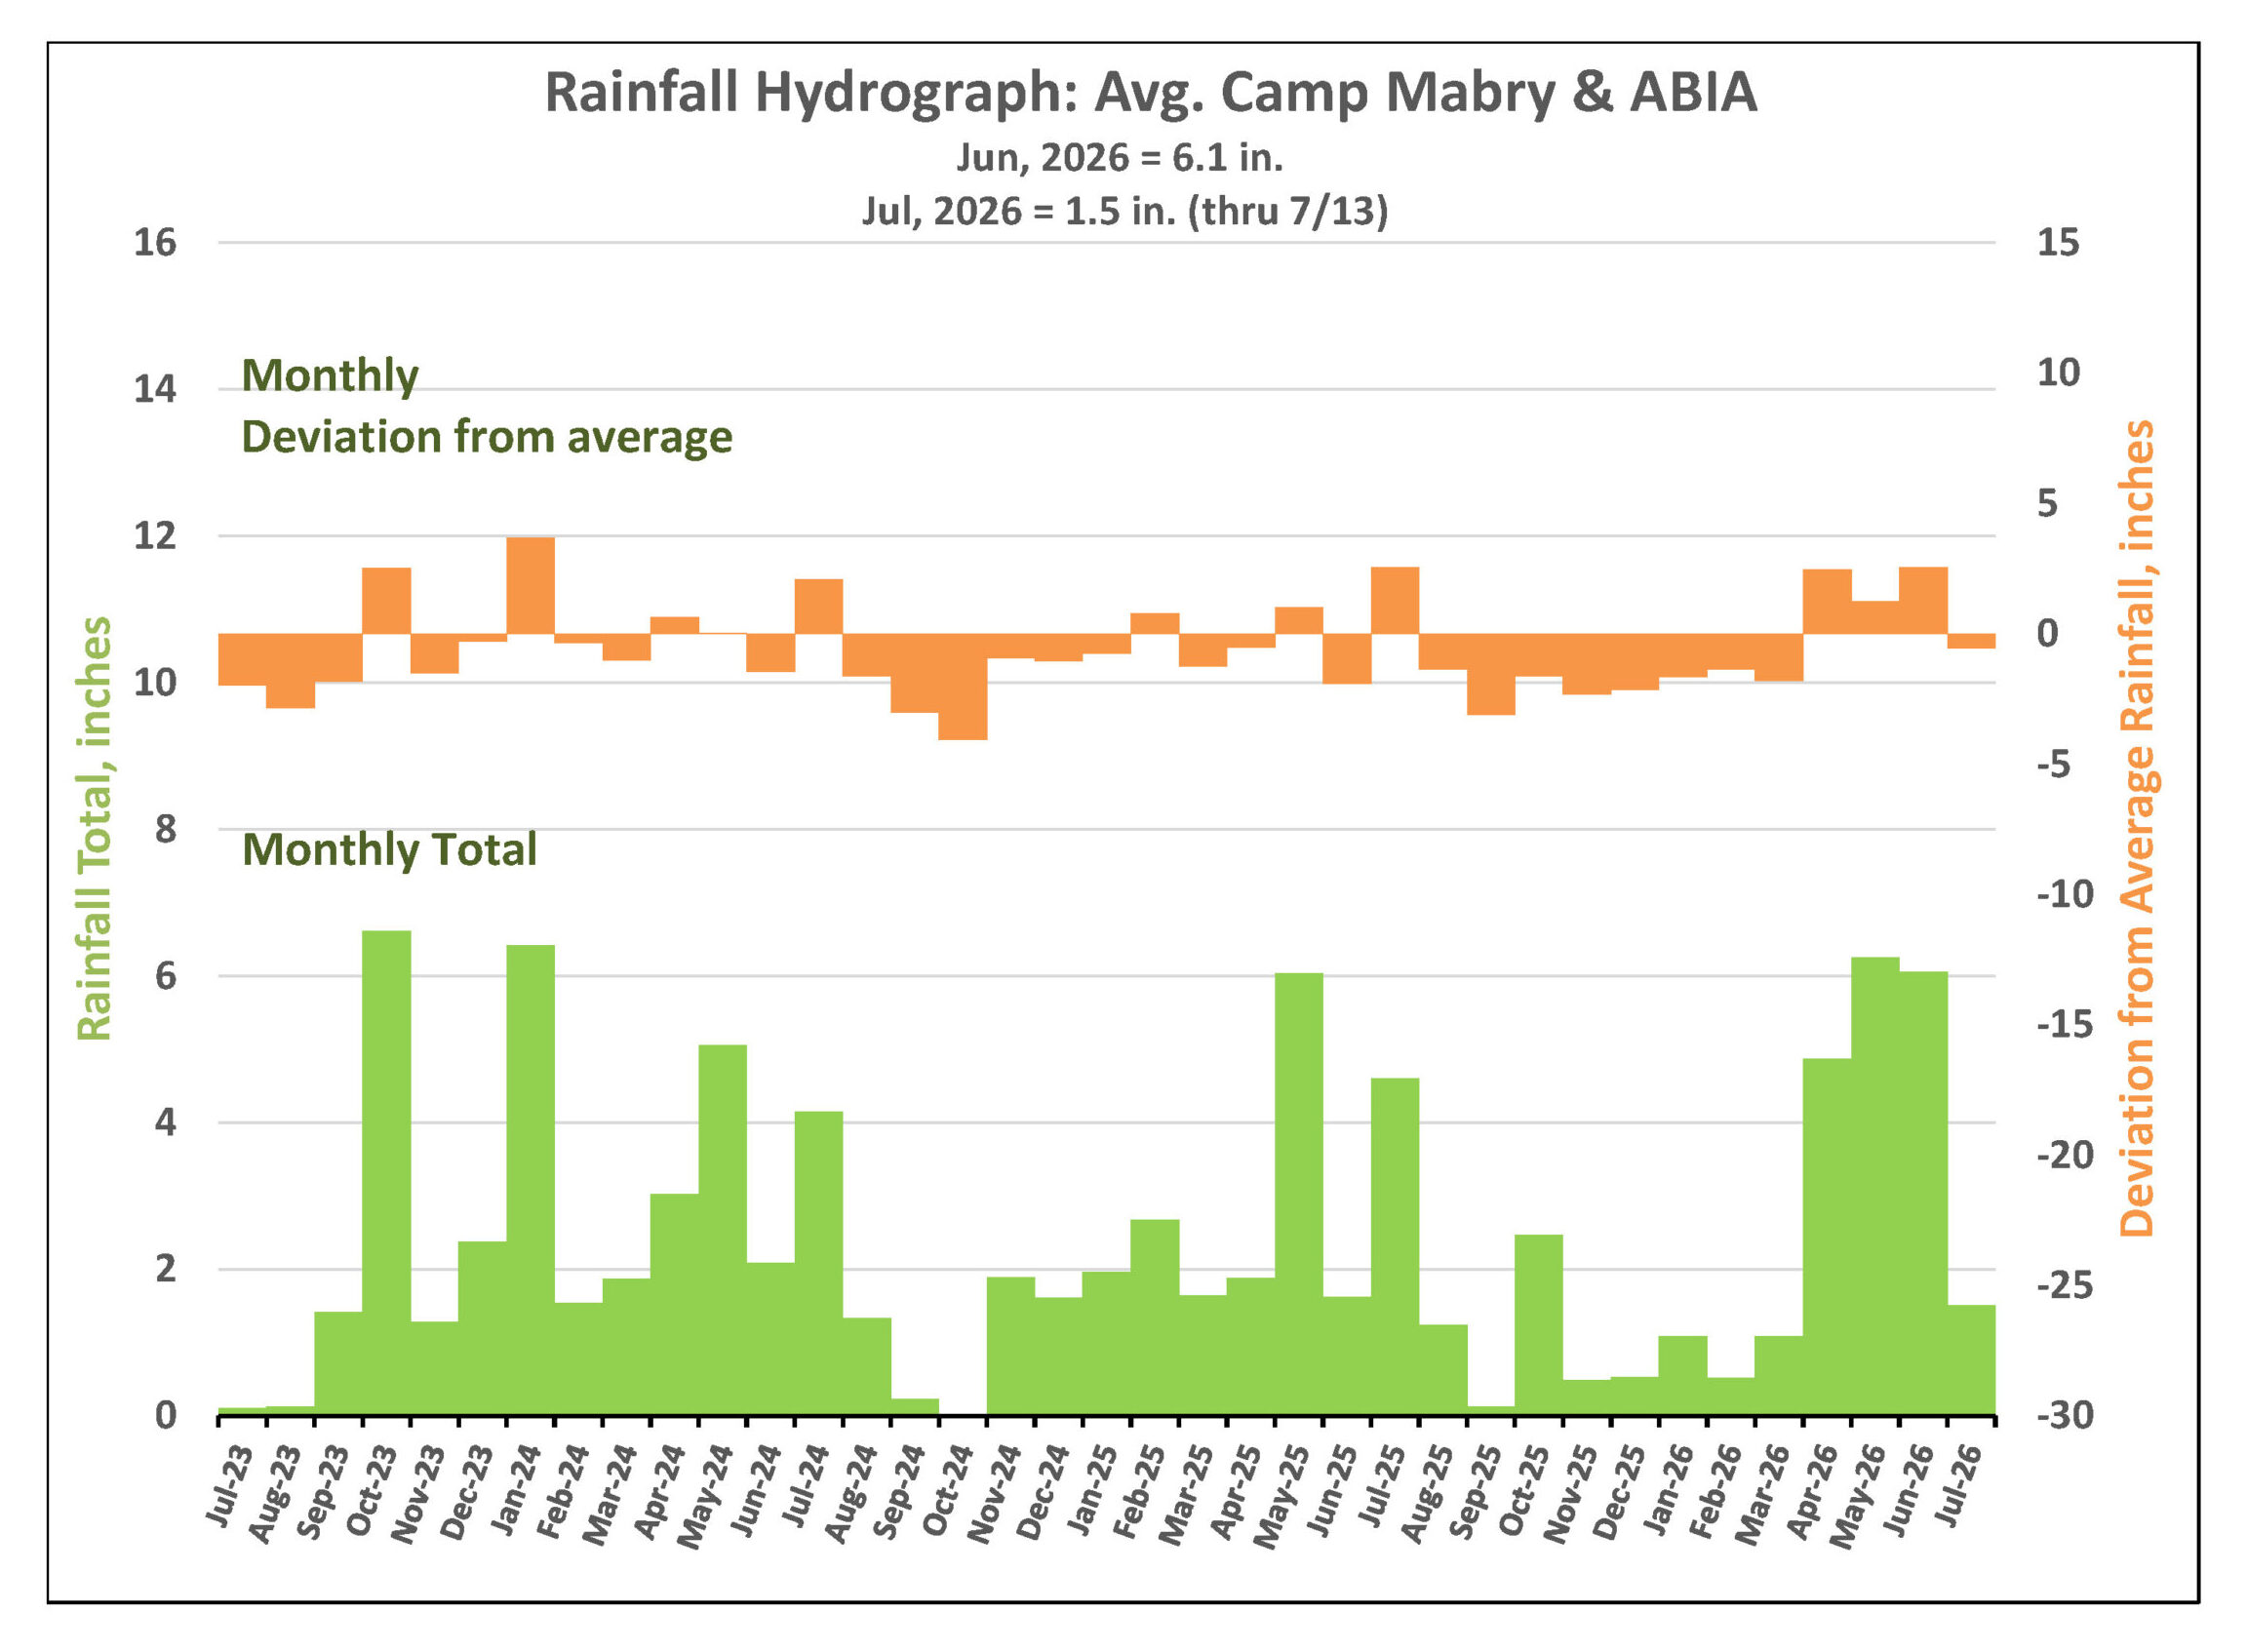
Figure 2. Monthly deviation from average and monthly total rainfall in District’s territory.
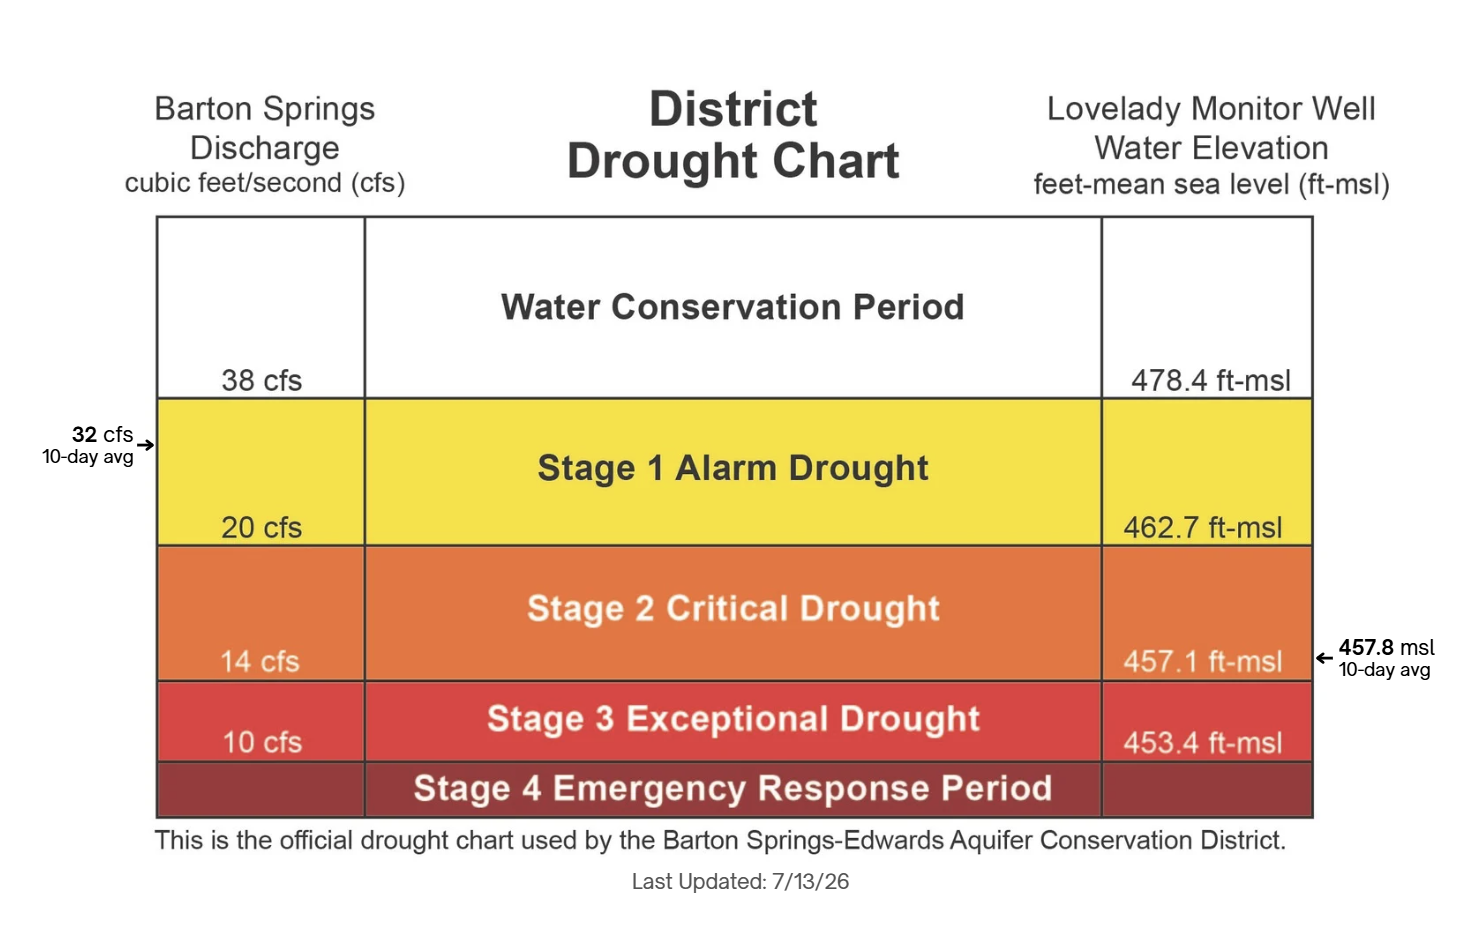
Figure 3. District Drought Chart as of 7/13/2026 displaying 10-day averages for springflow at Barton Springs (left) and groundwater levels at Lovelady monitor well (right)—both of which play a role in determining the District’s drought stage.
Barton Springs Flow
As of July 13, the 10-day average discharge at Barton Springs is 32 cubic feet per second (cfs). Springflow responded positively to recent rainfall, increasing from 24 cfs on June 14 to a peak of 62 cfs on June 16 (Figure 4).
Barton Springs flow is currently above the 20 cfs threshold associated with Stage 1 drought conditions. However, because the District’s drought stage is determined using both Barton Springs flow and groundwater levels in the Lovelady monitor well and both are beginning to trend back down, the District will remain in Stage 3 Exceptional drought for additional monitoring.
For the District to declare a less severe drought stage, both indicators’ 10-day average must improve beyond their respective drought stage thresholds. Additionally, the District can consider other factors, including the rain forecast, average water consumption, and seasonal patterns, when determining when and if to declare a new drought stage.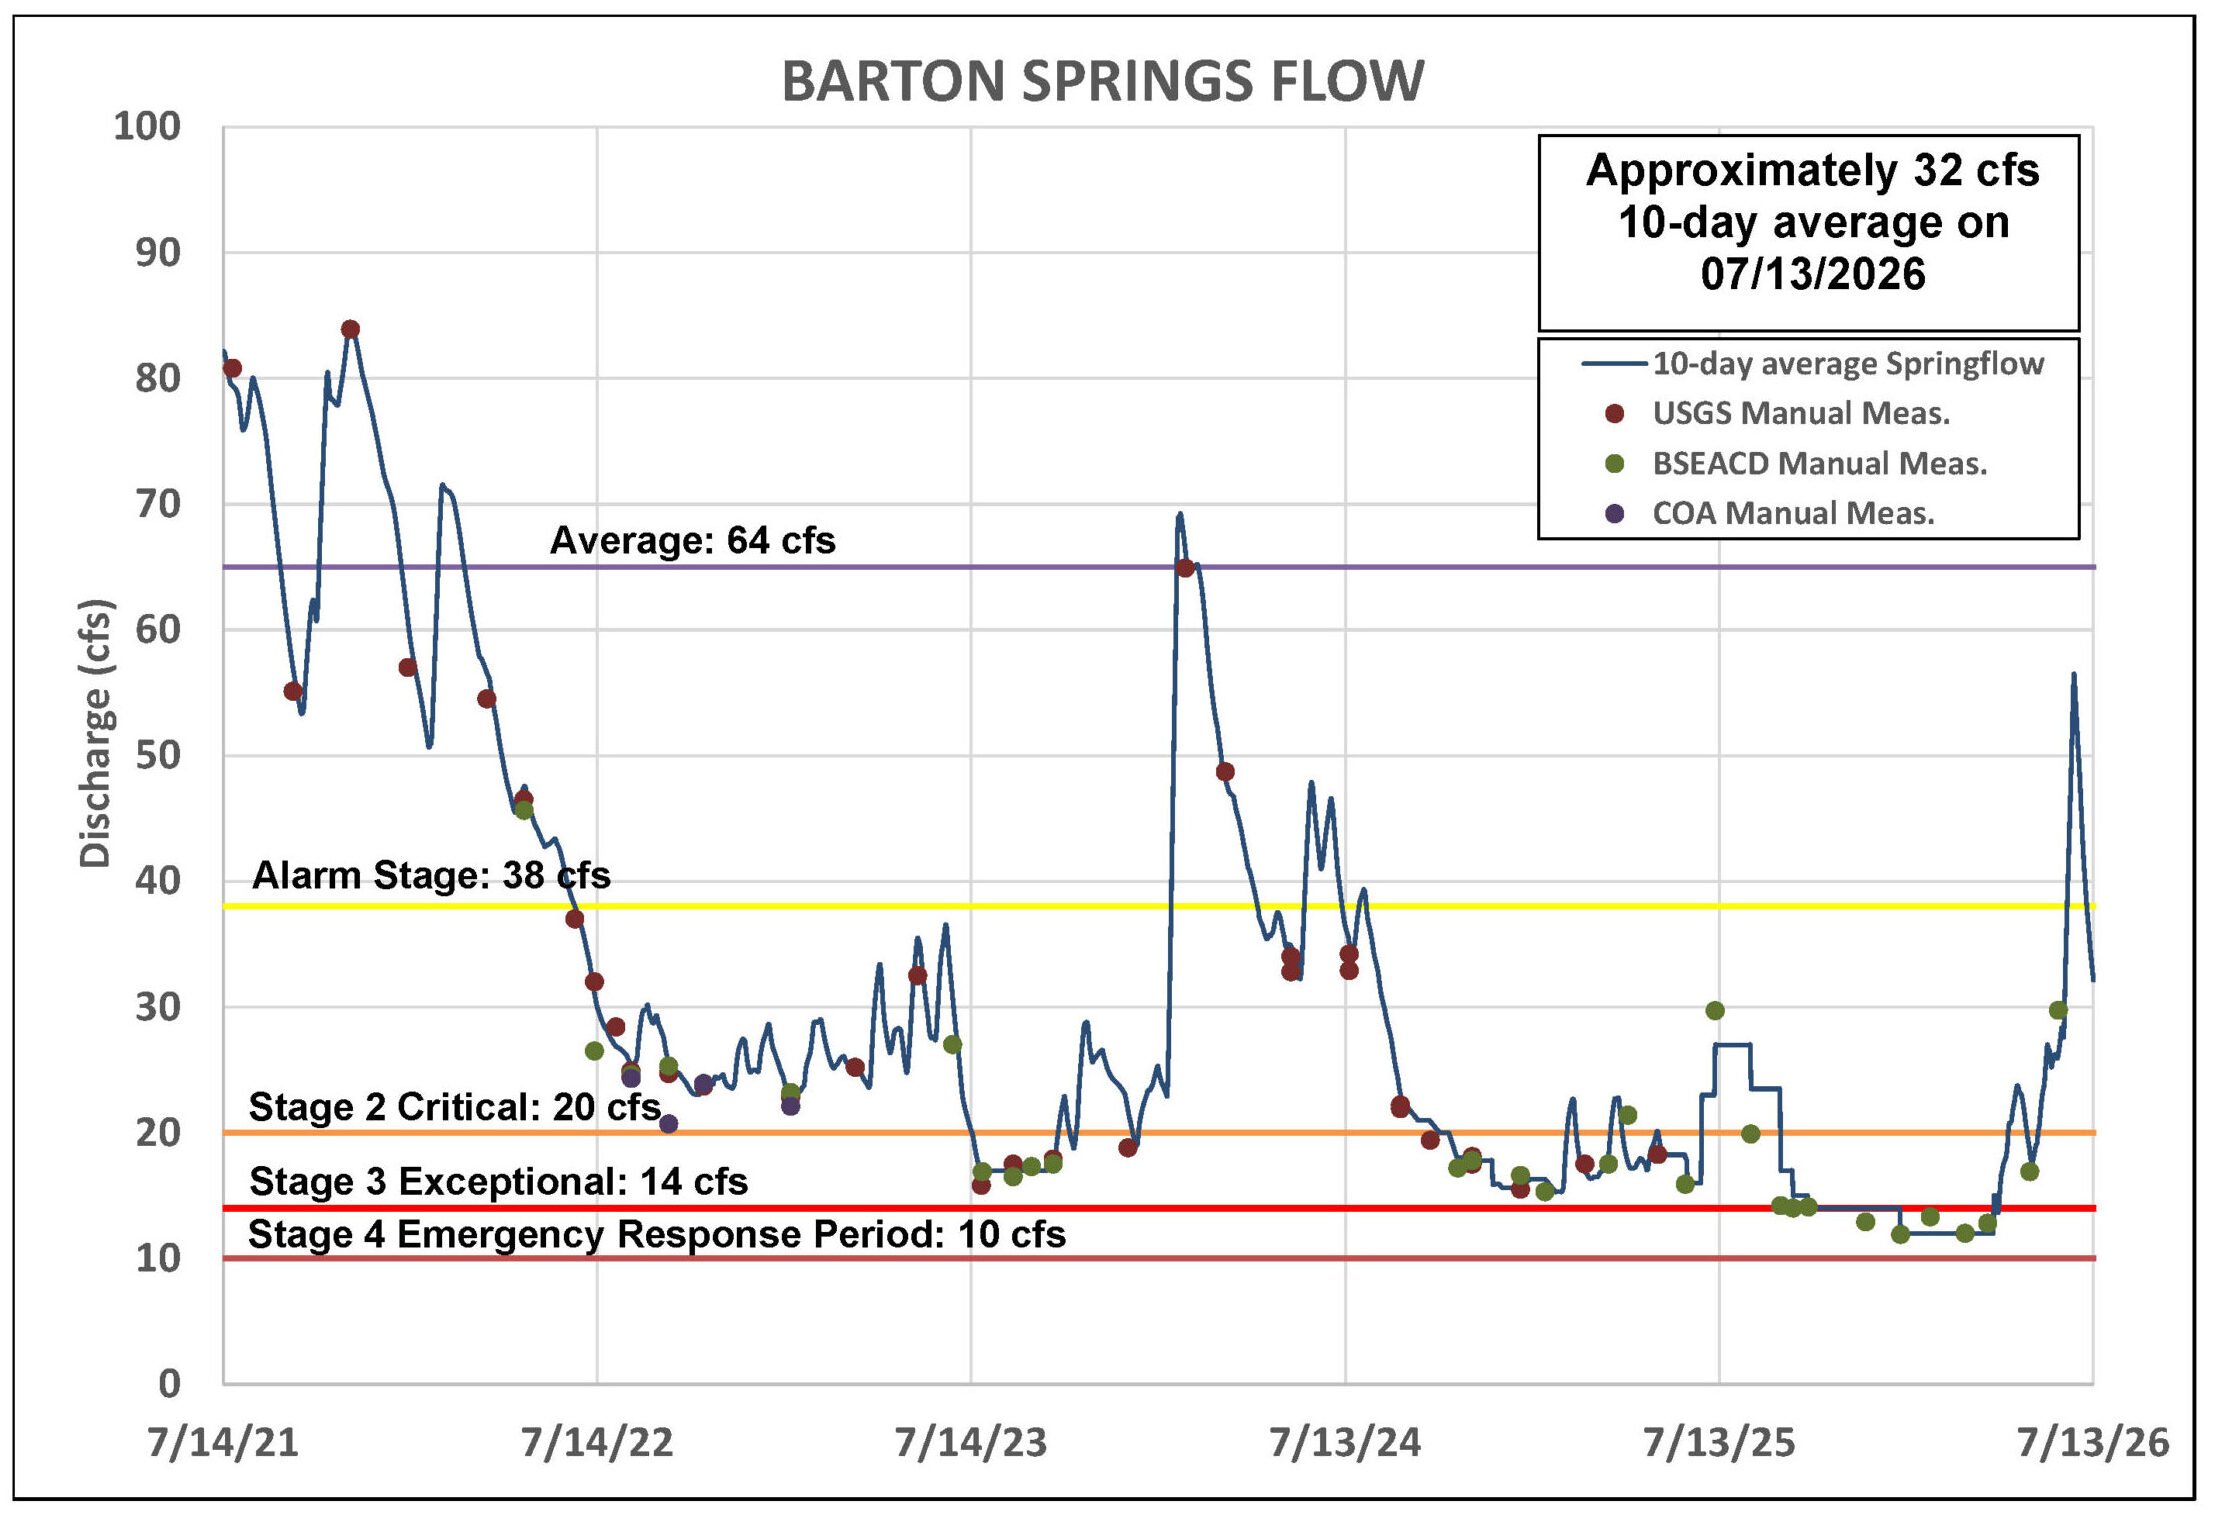
Figure 4. Barton Springs flow for the last five years.
*Note: Recent data for Barton Springs looks blockier than earlier, smoother records because it’s based on the average of two recent manual measurements, rather than continuous USGS gauge data.
Lovelady Monitor Well
As of July 13, the 10-day average water level at the Lovelady monitor well is 457.8 feet above mean sea level (ft-msl), up from 454.8 ft-msl on June 13– a rise of approximately 3.0 feet over the past month (Figure 5).
While these improvements are encouraging and water levels are currently within the Stage 2 Critical Drought range, the District has not yet lifted its Stage 3 Exceptional Drought declaration. To protect local drinking water wells, District staff and the Board will continue monitoring groundwater levels and springflows over the coming weeks to determine whether these recent gains are sustained through the hottest part of the summer. Those observations will help inform whether the Board lowers the drought stage or maintains Stage 3 Exceptional Drought at its August meeting.
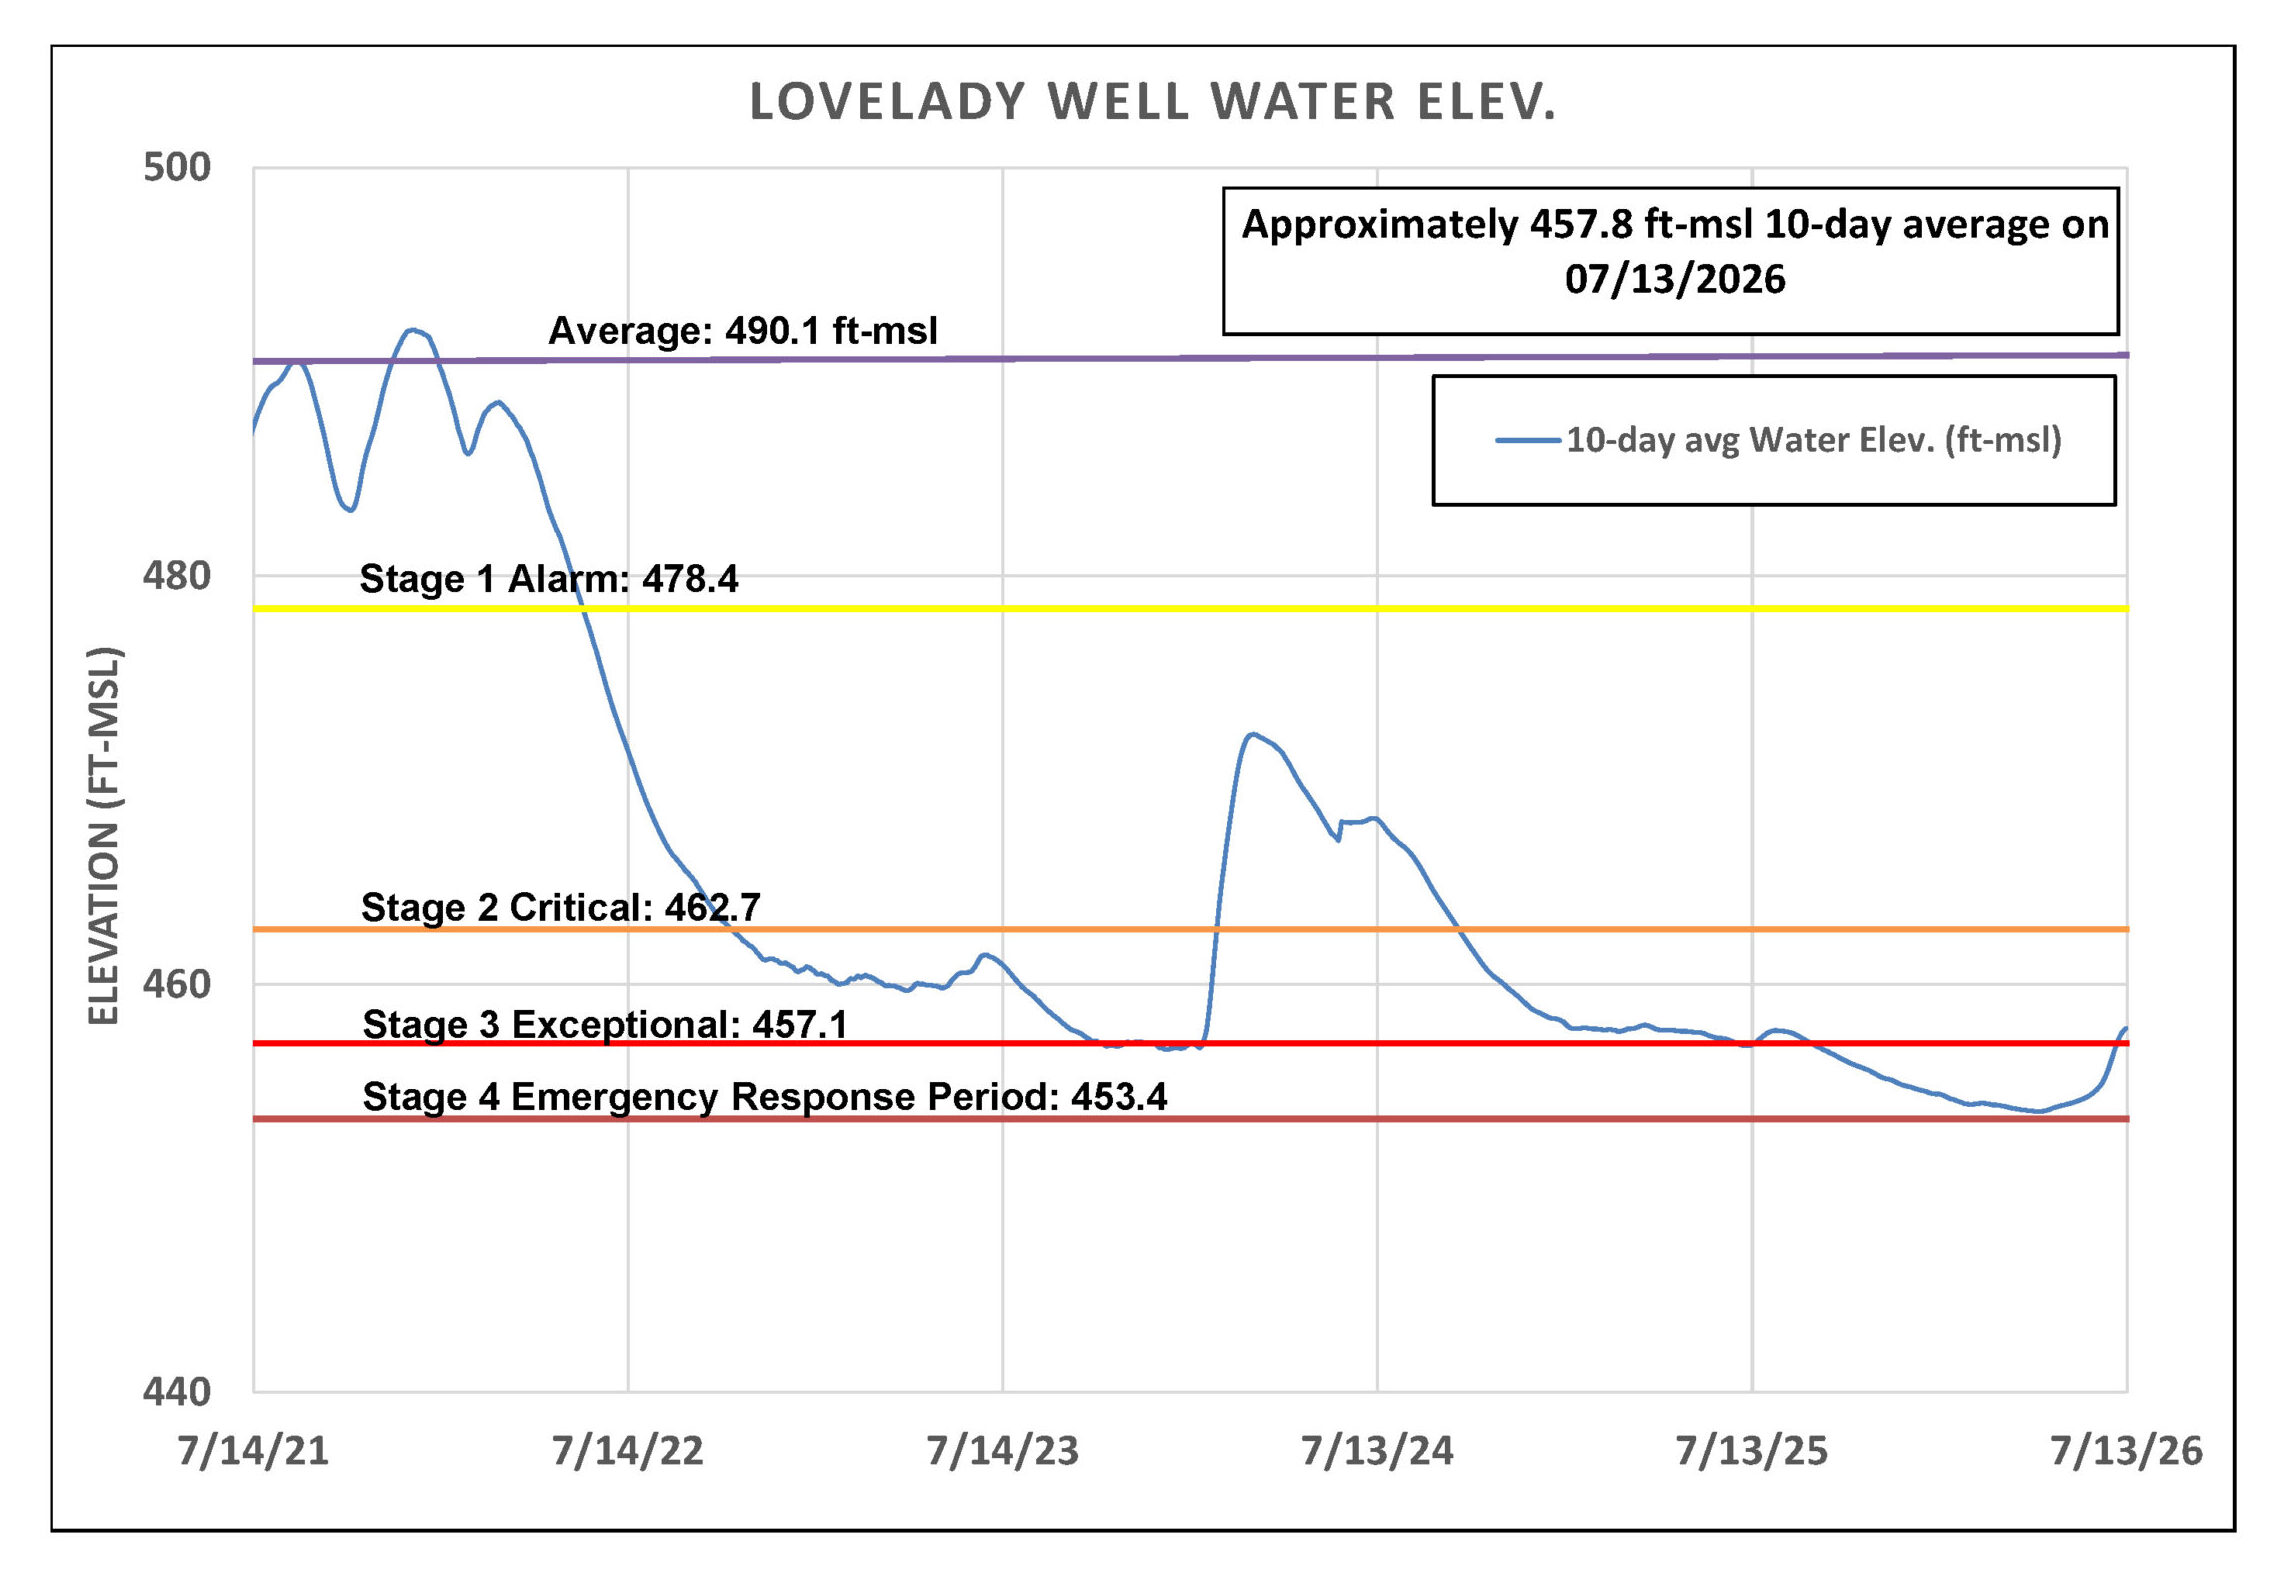
Figure 5. Lovelady groundwater level over the last five years.
Trinity Aquifer
Groundwater levels in the Trinity Aquifer have also seen gains in the last three months. The Lowe-Coronado Middle Trinity monitor well has risen approximately 11 feet since April (Figure 6), a positive trend that is being observed – and in some areas exceeded – in portions of the Upper Trinity Aquifer.
Jacobs Well Spring Mean also responded to recent rainfall, peaking at 26 cfs on June 15 and currently maintaining a flow of just under 1 cfs. As of July 13, the spring’s 10-day average flow is 0.4 cfs. Meanwhile, the Blanco River at Wimberley has maintained baseflows between 3 and 4 cfs. While streamflows remain relatively low, rainfall has provided modest but measurable benefits to both springflow and river conditions within the watershed.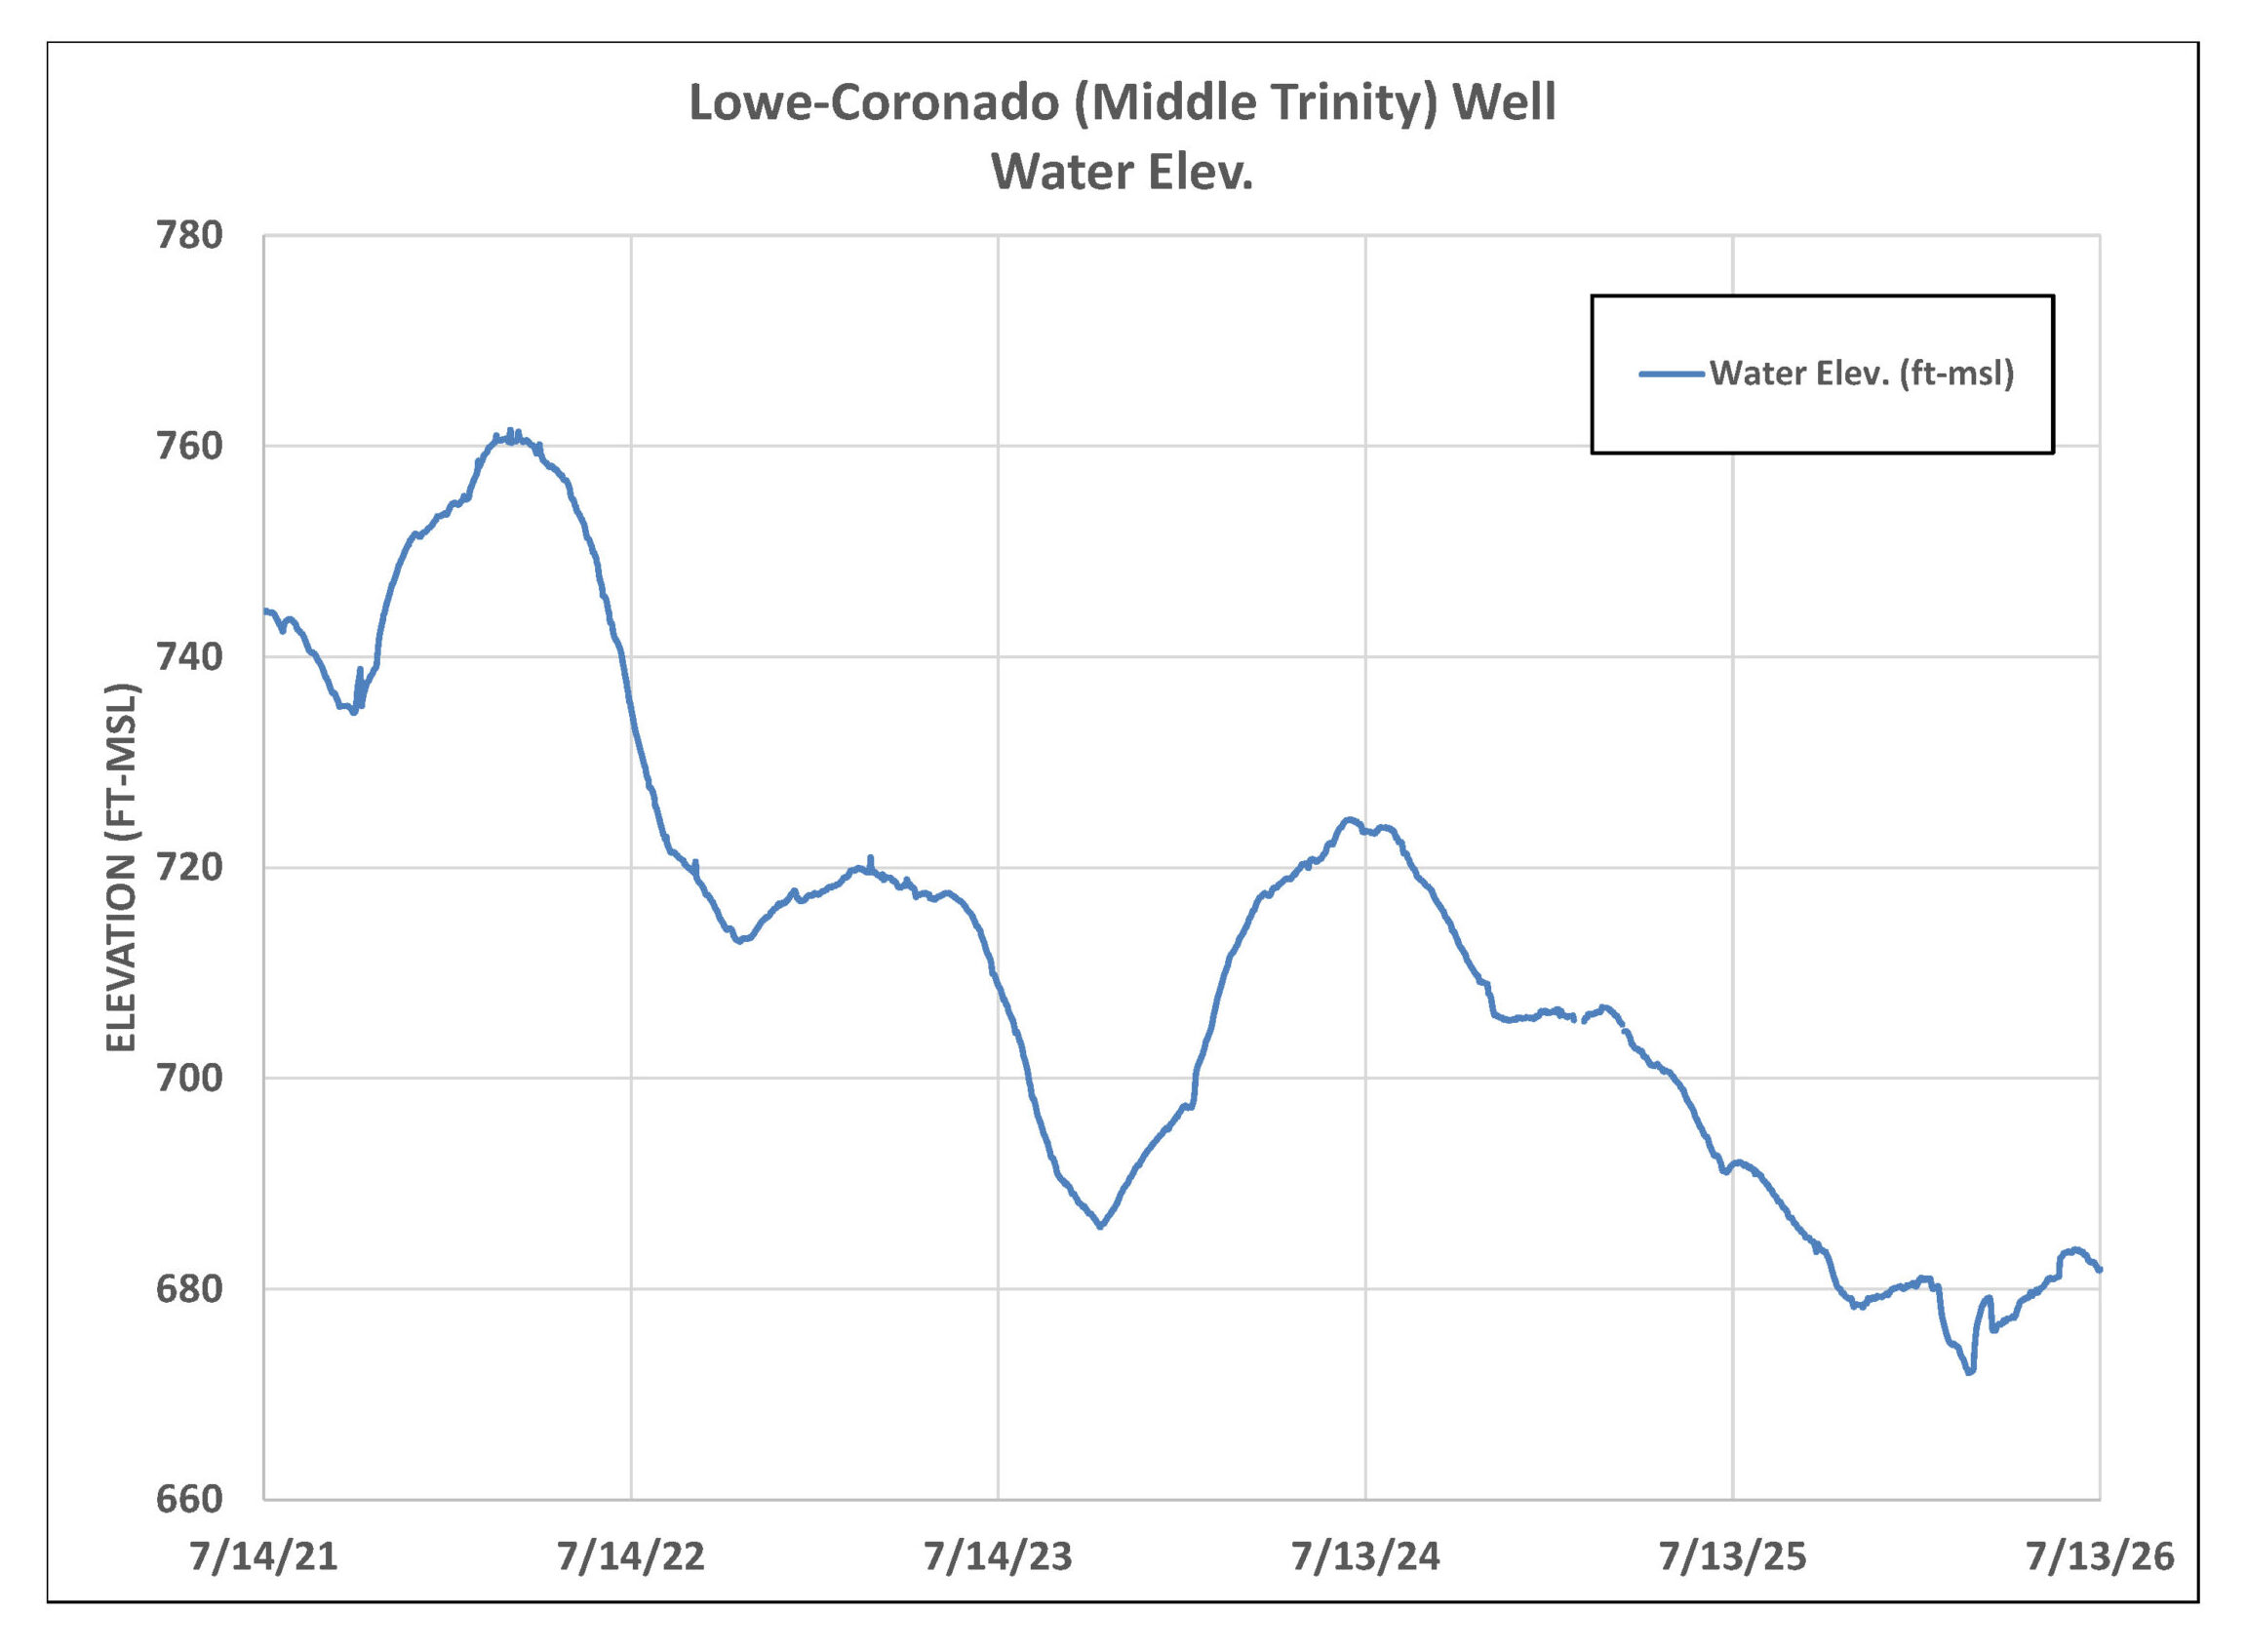
Figure 6. Lowe-Coronado (Middle Trinity) monitor well water-level elevation.