

District’s Current Drought Status: Stage 3 Exceptional Drought
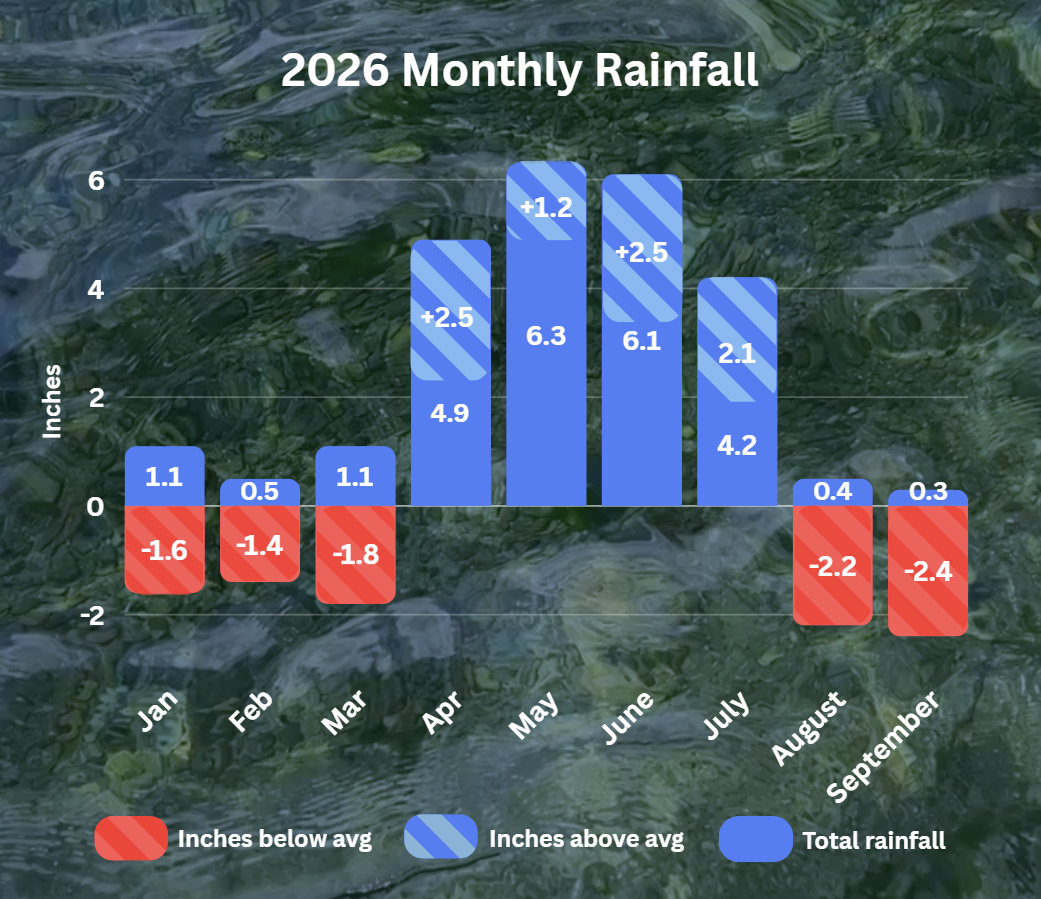
Figure 1. Monthly deviation from average and monthly total rainfall in District’s territory for 2026.
Rainfall Recap
September was exceptionally dry across Central Texas. Camp Mabry recorded just 0.47 inches of rain, while Austin – Bergstrom International Airport (ABIA) received only 0.08 inches. Averaged between the two stations, September rainfall totaled approximately 0.3 inches – about 2.4 inches below the long-term monthly average and ranking as the 14th driest September on record (Figure 1).
Through September 2026, the region has received approximately 23.8 inches of rainfall, or about 66% of the historical annual average of 36 inches. This puts 2026 on a rainfall trajectory similar to the previous two years, continuing the pattern of below-average annual rainfall experienced across the region (Figure 2).
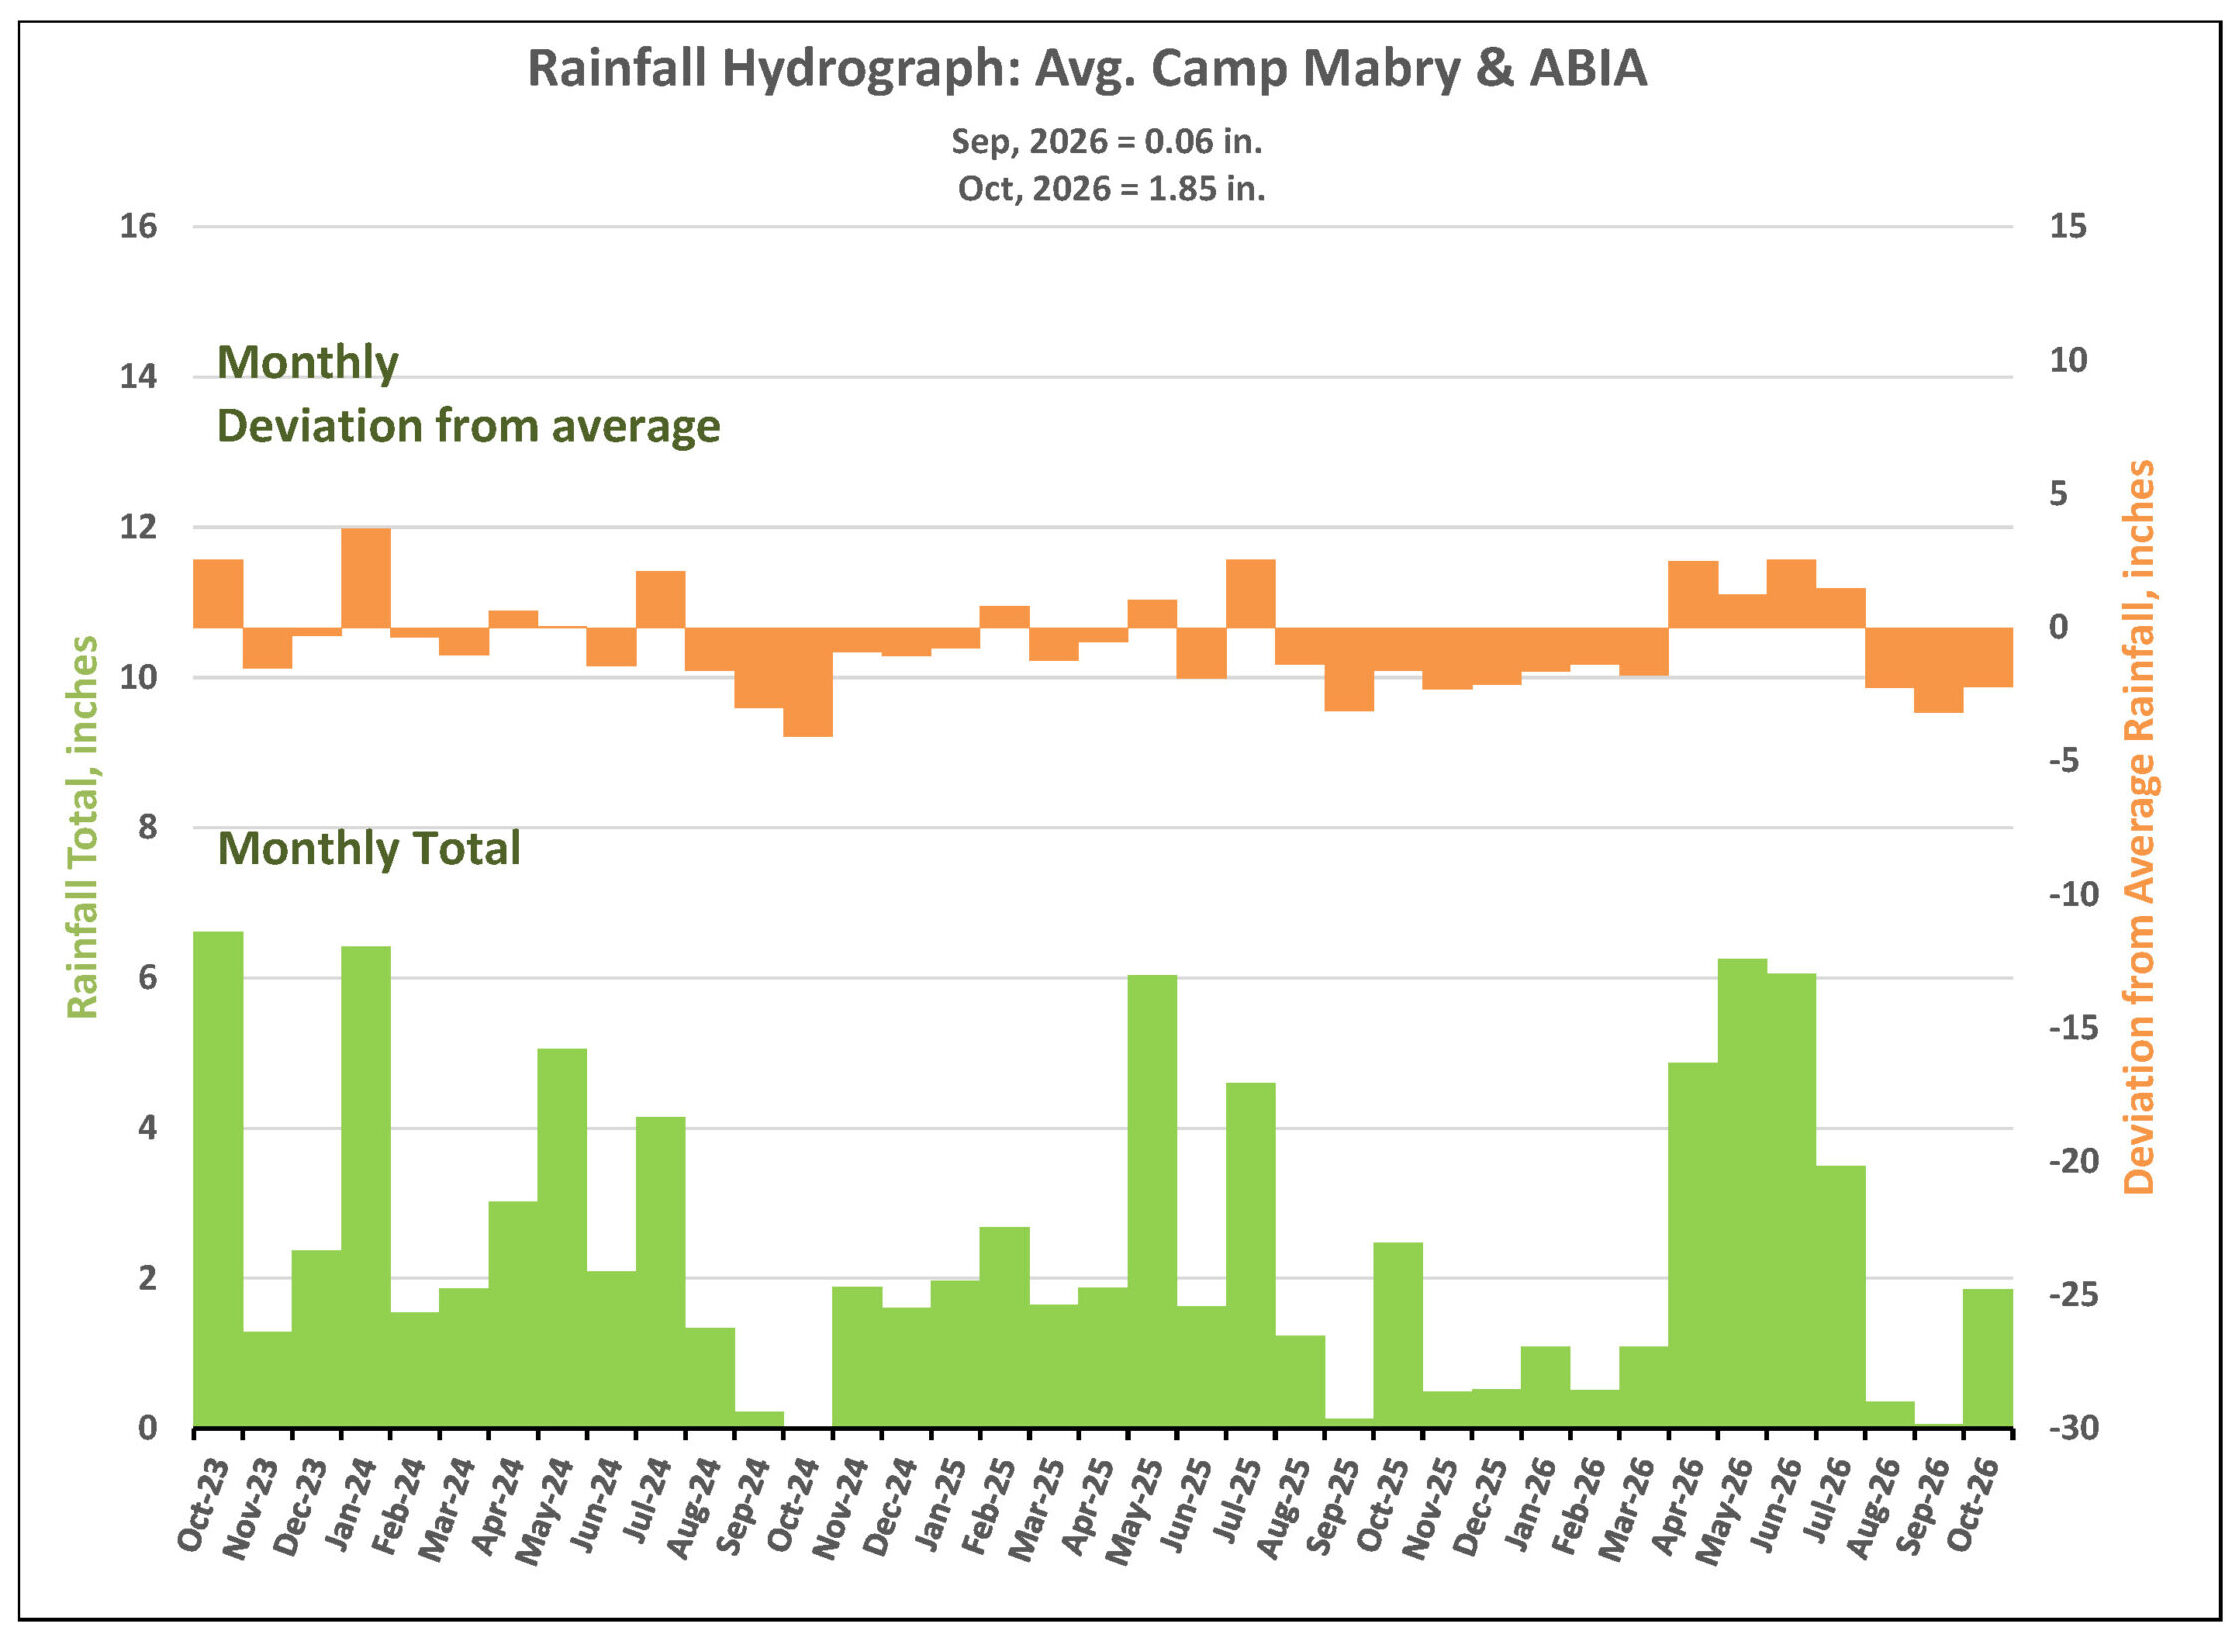
Figure 2. Monthly deviation from average and monthly total rainfall in District’s territory.
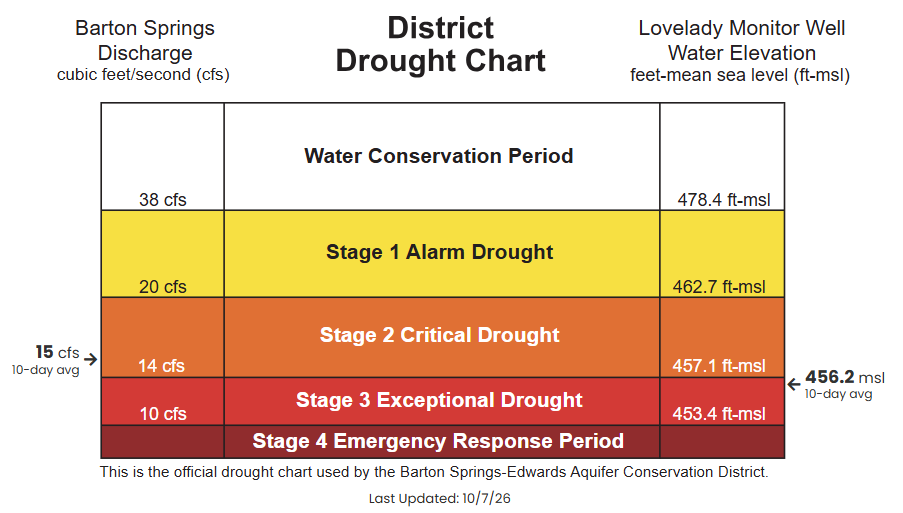
Figure 3. District Drought Chart as of 10/07/2026 displaying 10-day averages for springflow at Barton Springs (left) and groundwater levels at Lovelady monitor well (right)—both of which play a role in determining the District’s drought stage.
Barton Springs Flow
As of October 8, the 10-day average discharge at Barton Springs is 15 cubic feet per second (cfs) (Figure 4). Following the very dry August and September, spring flow has continued to decline. Much of the early-October rainfall was absorbed by dry soils, resulting in limited runoff and recharge to the aquifer.
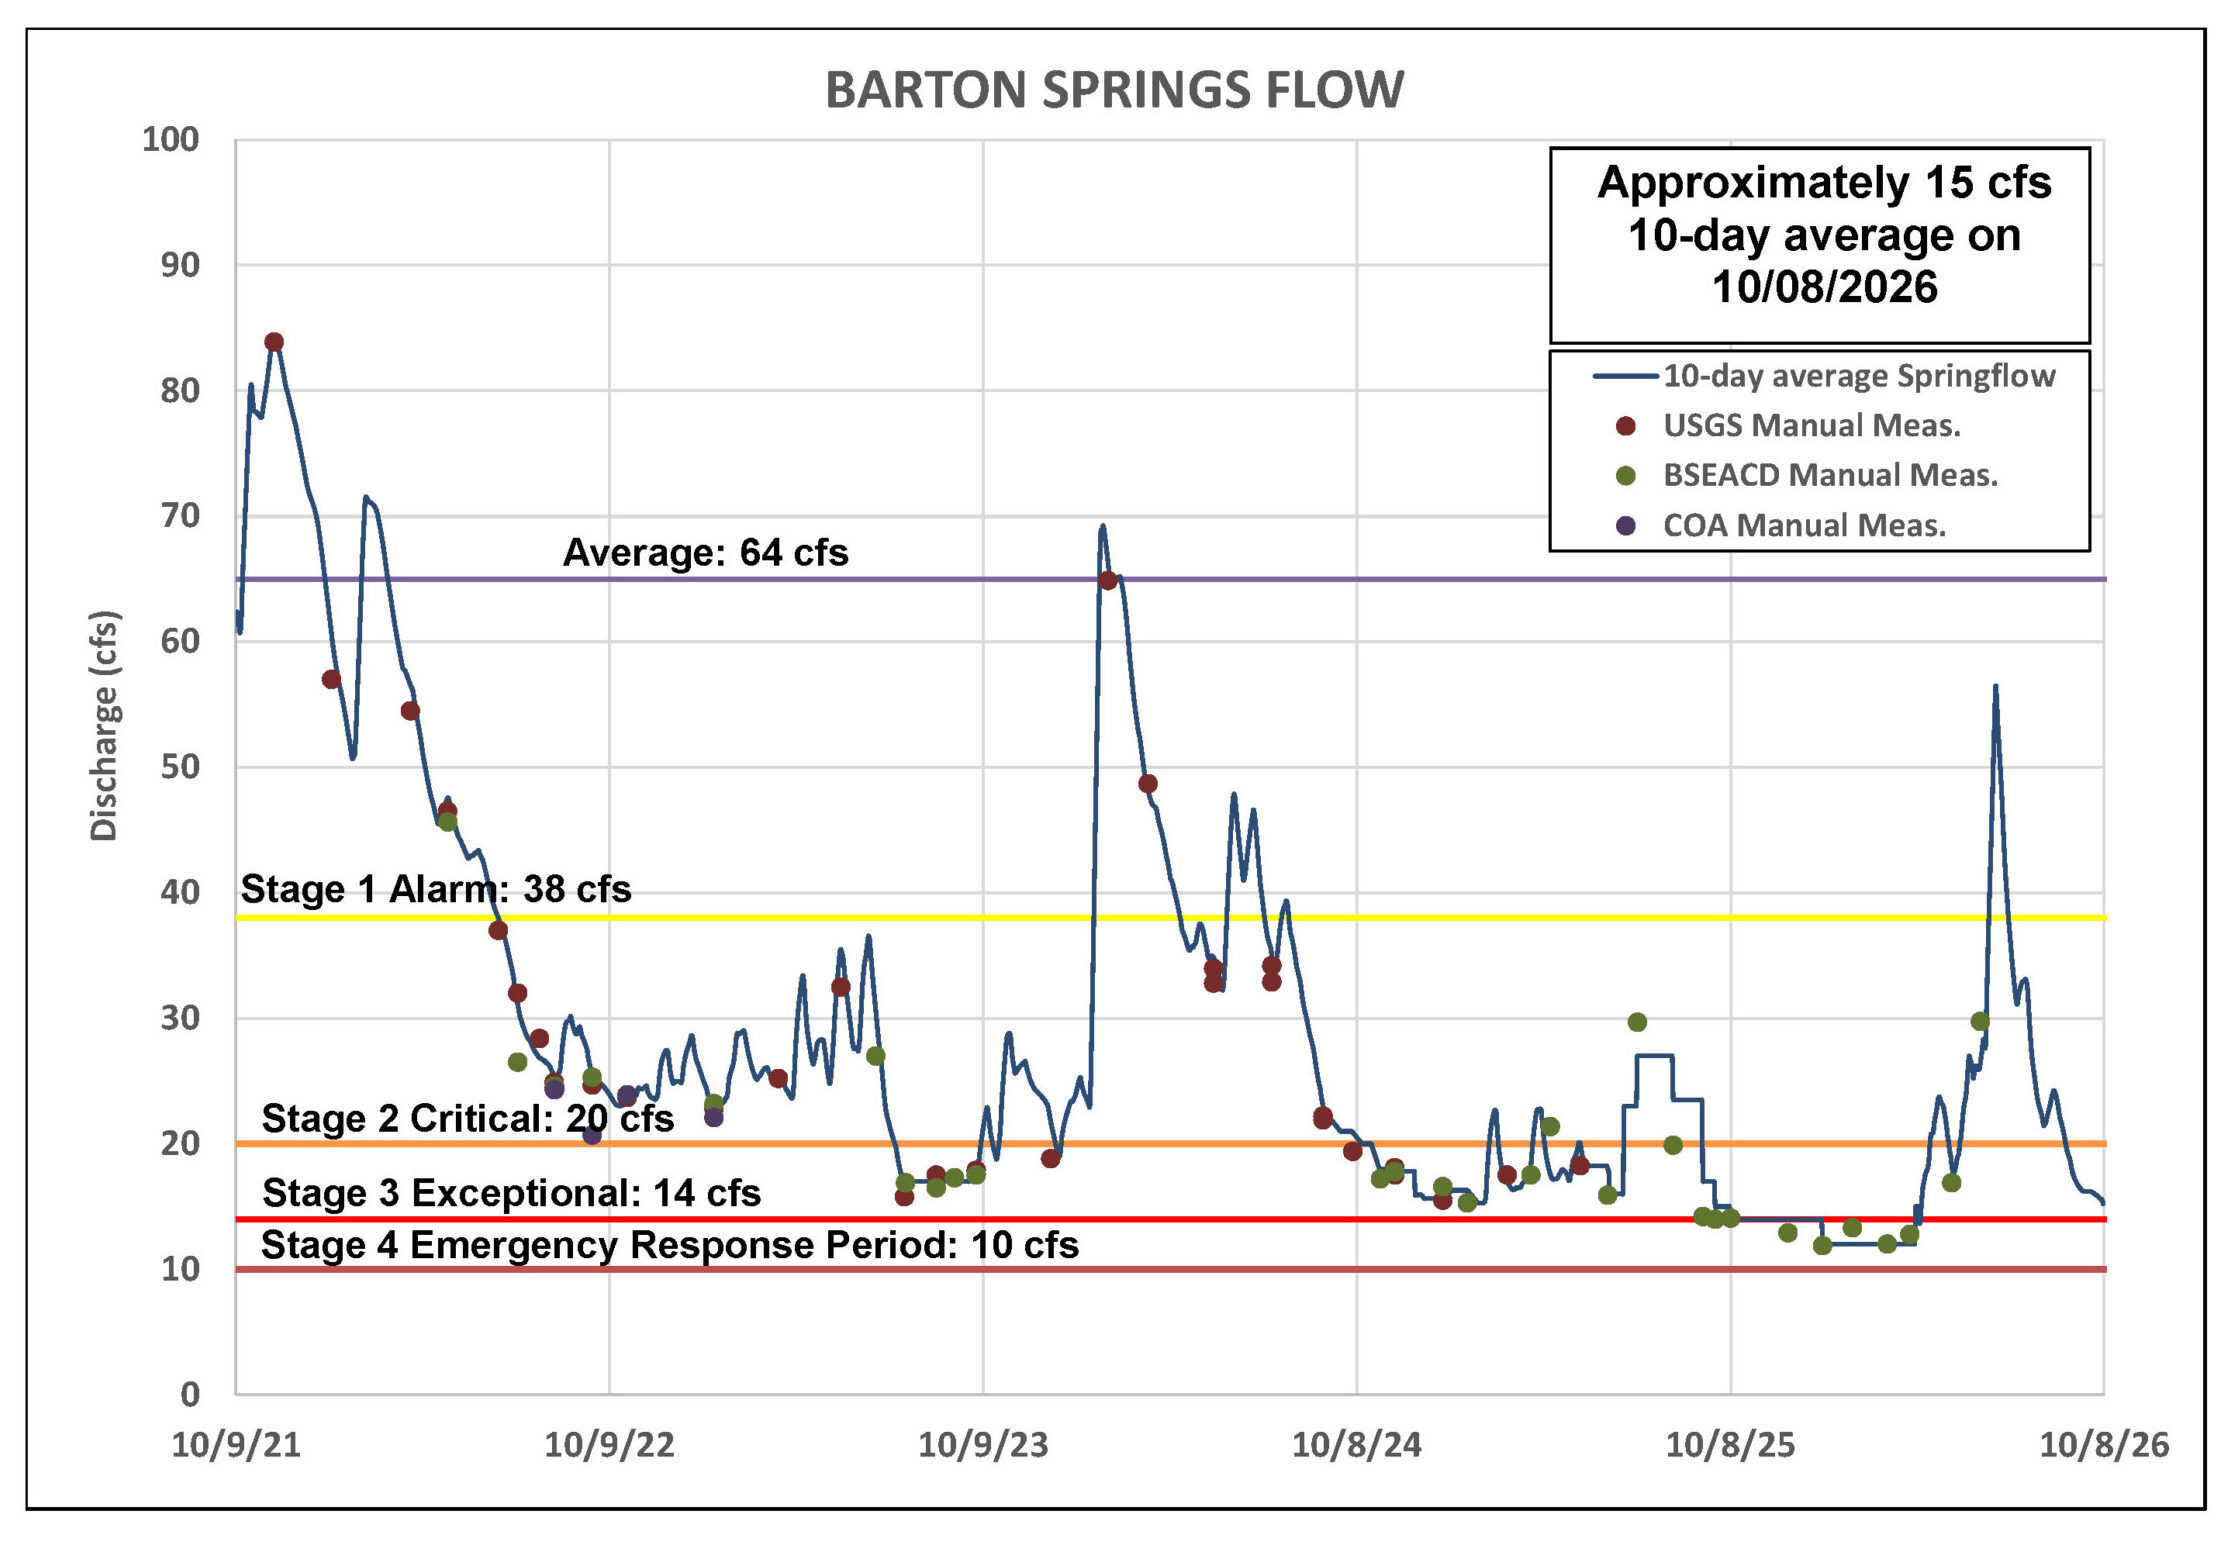
Figure 4. Barton Springs flow for the last five years.
*Note: Recent data for Barton Springs looks blockier than earlier, smoother records because it’s based on the average of two recent manual measurements, rather than continuous USGS gauge data.
Lovelady Monitor Well
As of October 8, the 10-day average water level at the Lovelady Monitor Well is 456.2 feet above mean sea level (ft-msl), placing the District within the Stage 3 Exceptional Drought threshold (Figure 5). Similar to the conditions observed at Barton Springs, the early-October rains provided little benefit to Lovelady’s continued downward trend.
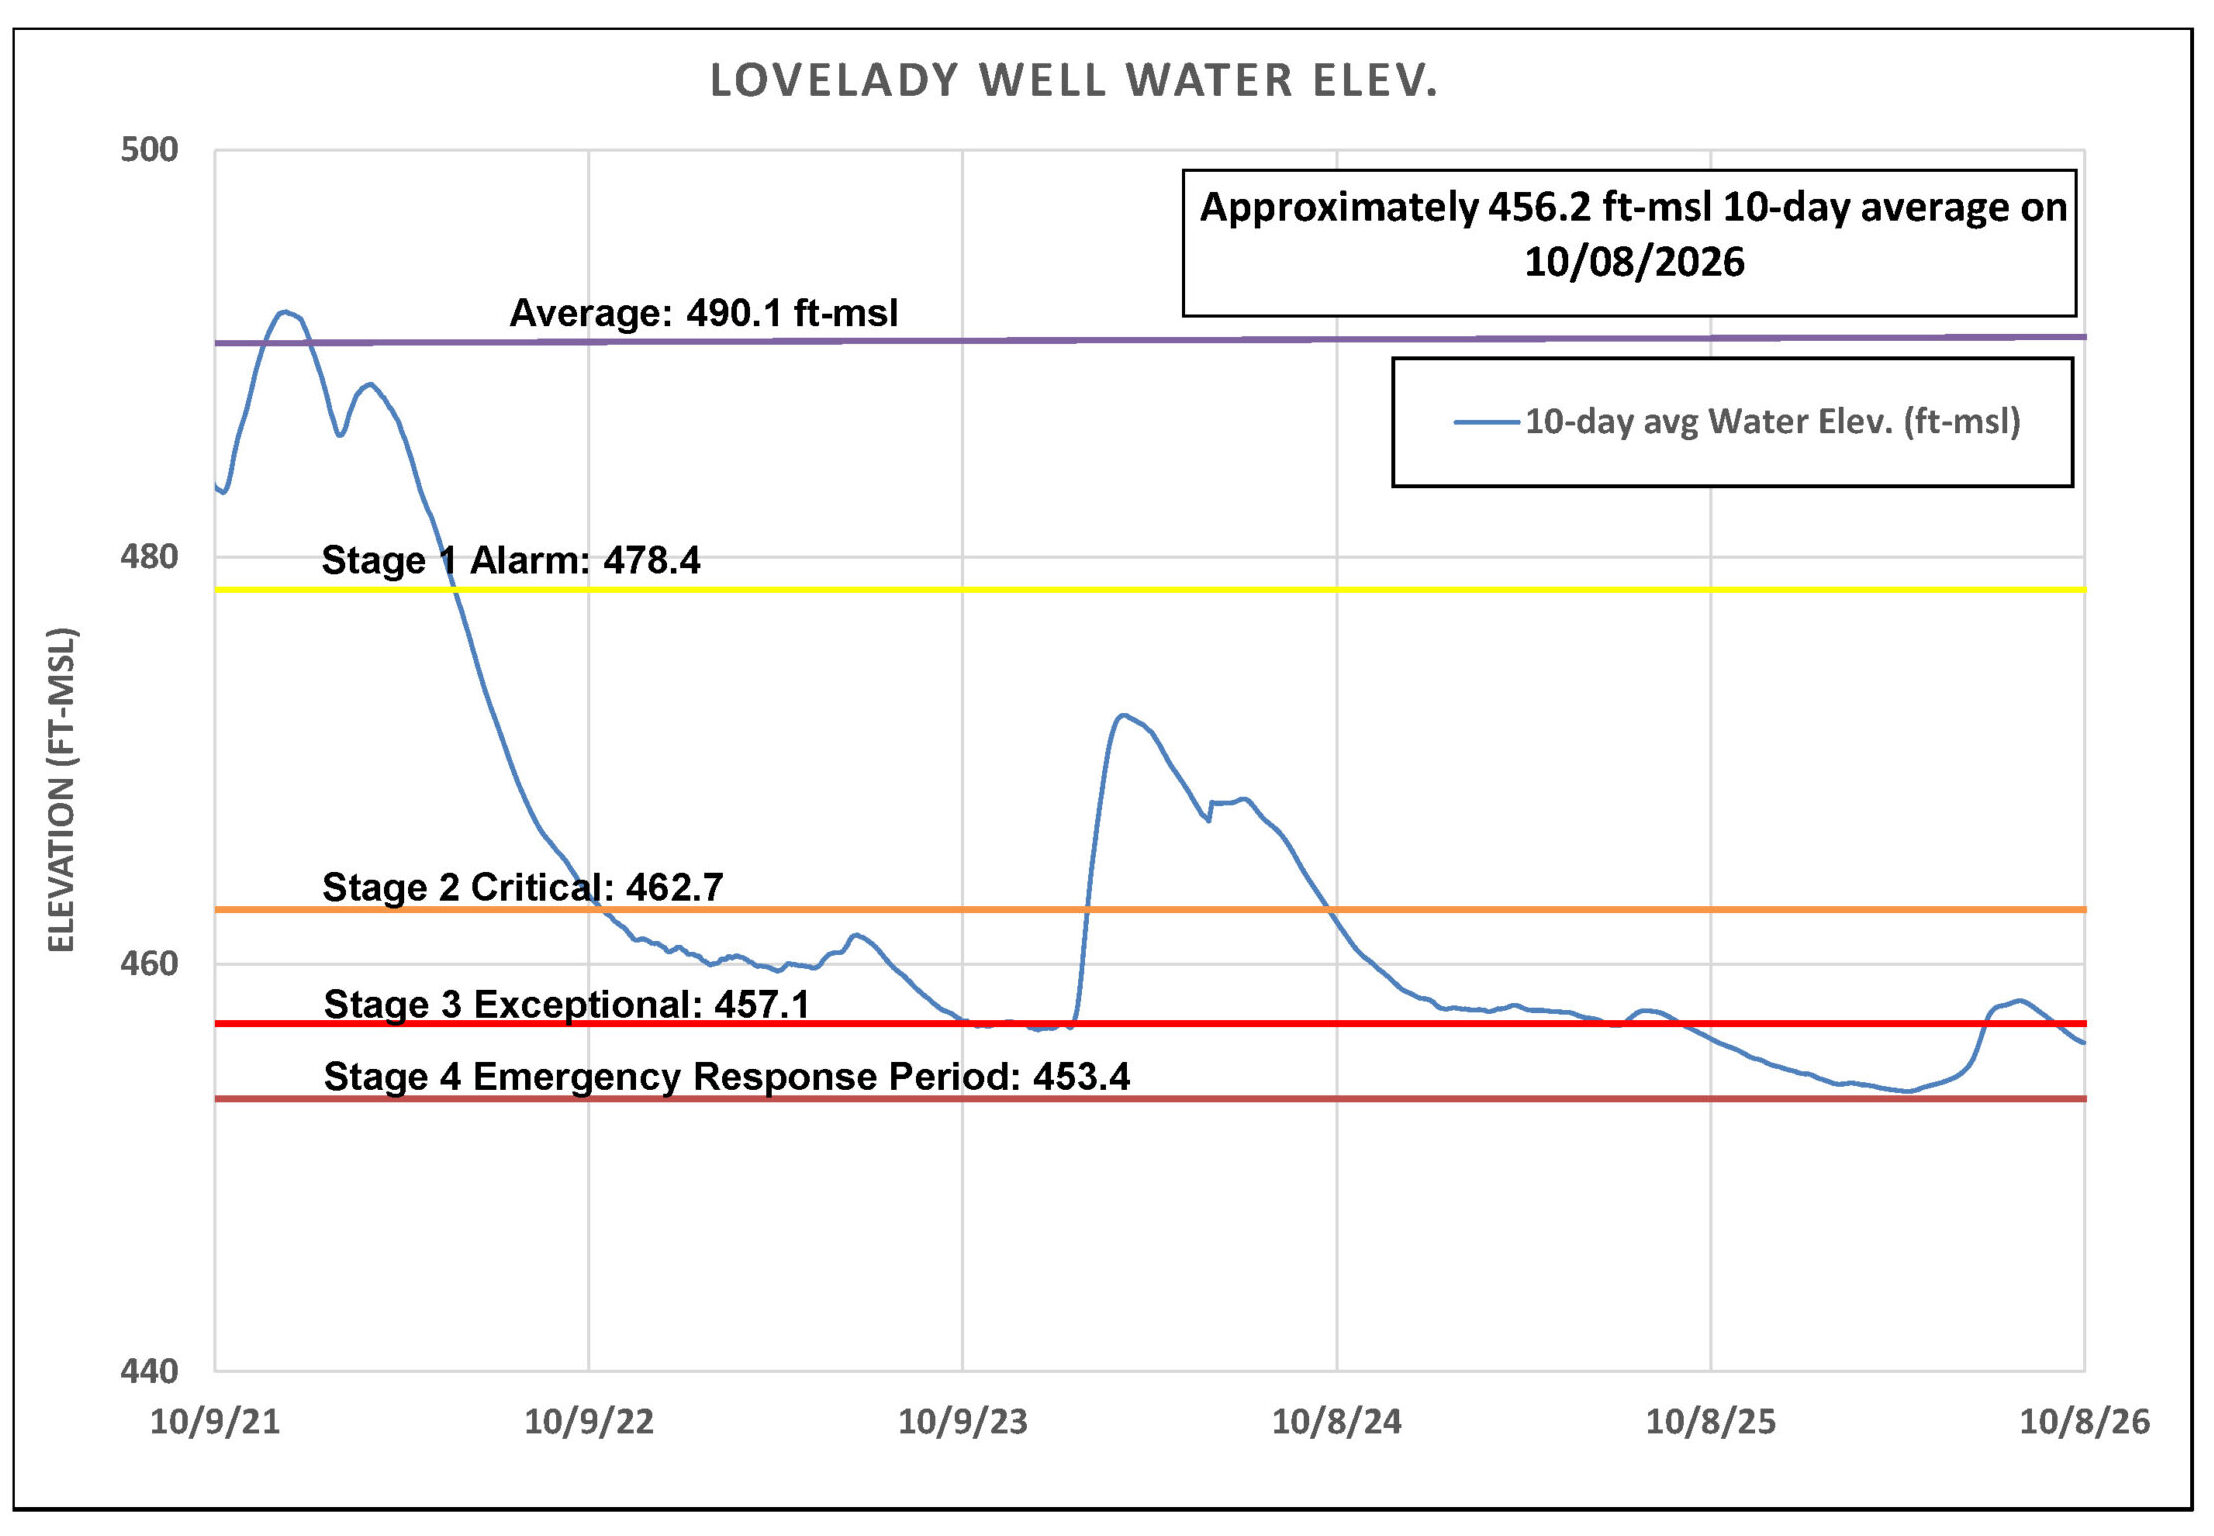
Figure 5. Lovelady groundwater level over the last five years.
Trinity Aquifer
Groundwater levels in the Trinity Aquifer also showed little to no improvement following the recent rainfall, most of which was concentrated in the western portion of the Hill Country. The Lowe-Coronado Middle Trinity monitor well continued its steady decline since late July (Figure 6), with similar downward trends observed in the Upper Trinity Aquifer.
Surface-water conditions reflect the same persistent drying trend. Jacobs Well Spring has remained at zero flow since mid-August. The Blanco River at Wimberley responded briefly to the early October rainfall, with flow increasing to approximately 30 cfs before quickly receding. Flows have since returned to the low teens, remaining well below normal.
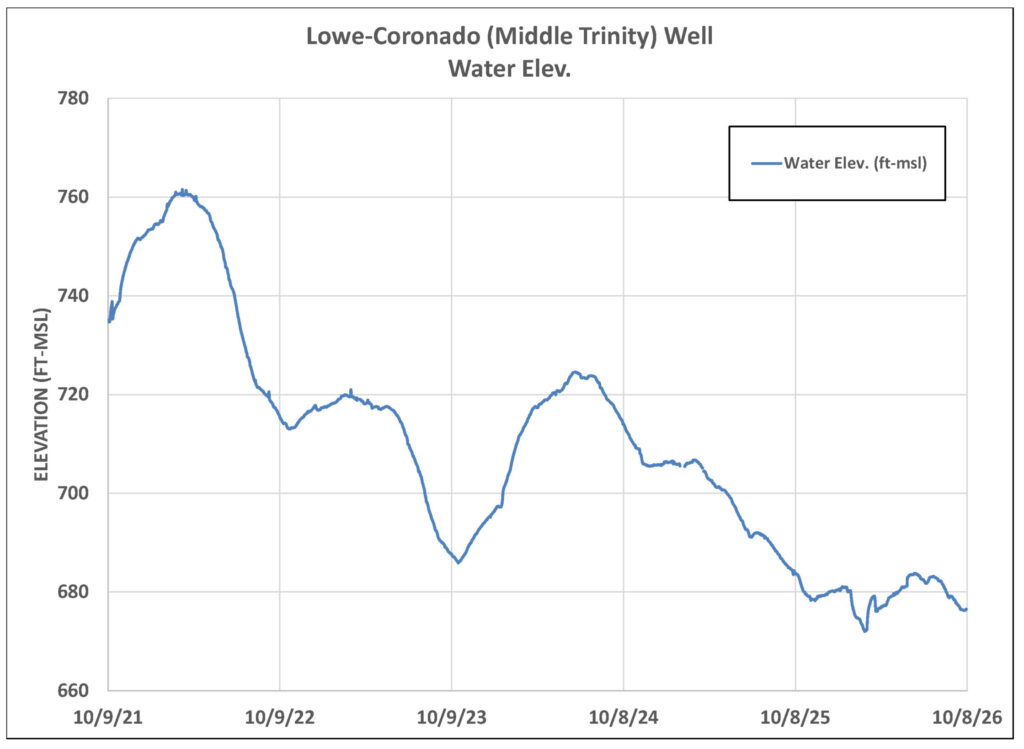
Figure 6. Lowe-Coronado (Middle Trinity) monitor well water-level elevation.
Outlook
The Climate Prediction Center’s October through December outlook shows increased chances for above-average rainfall across Central Texas (Figure 7). With October typically ranking as one of Central Texas’ wettest months, there is still reason to be optimistic for additional rainfall in the weeks ahead. The first hurricane of the season to form in the Gulf is expected to stay east of Texas, bringing its heaviest rainfall to parts of Mississippi and Alabama instead.
Rainfall in the spring and early summer months helped improve aquifer conditions and slow the effects of the ongoing drought. Continued, well-distributed rainfall through the fall and early winter will be important to support further recovery in groundwater levels, springflow, and streamflow across the District.
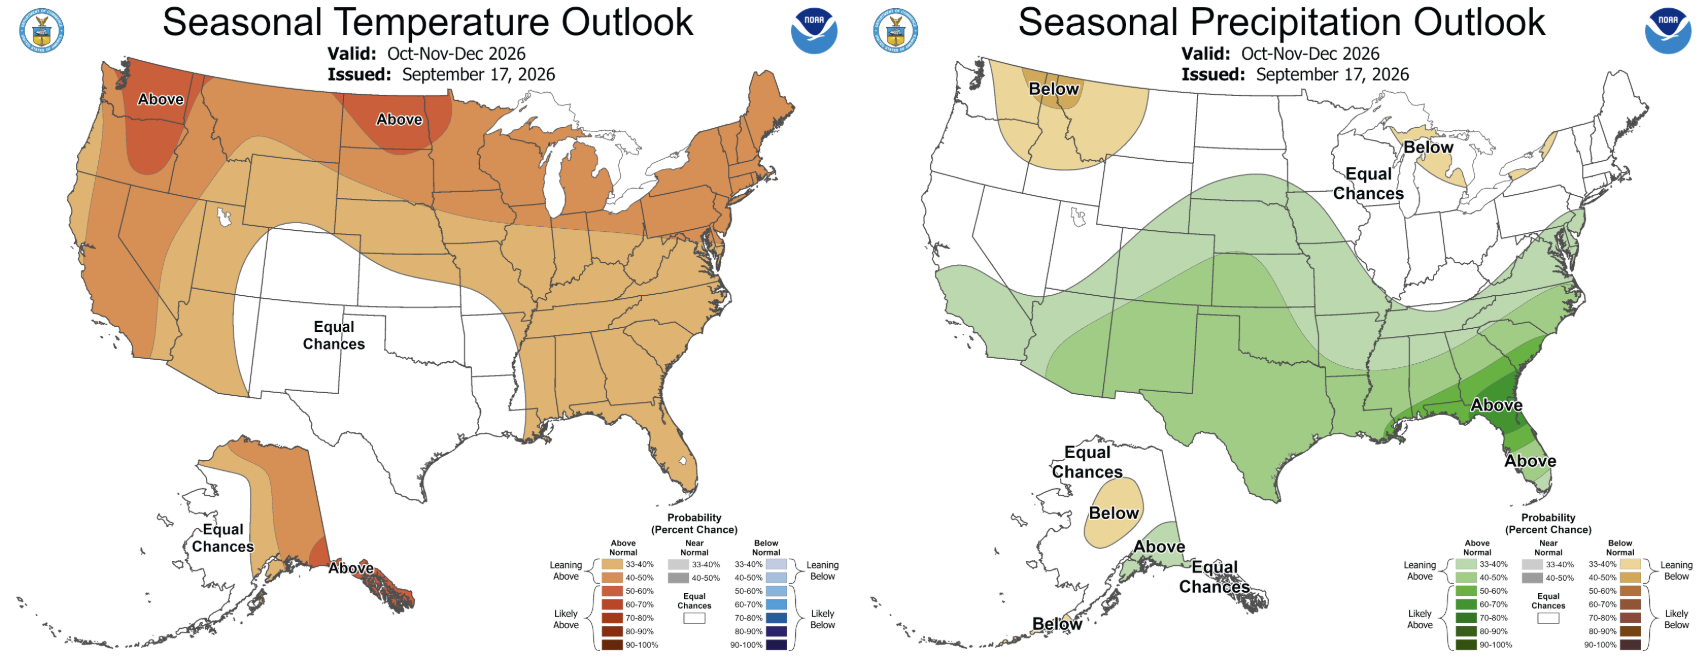
Figure 7. October-November-December Seasonal Precipitation Outlook for the US according to the climate Prediction Center.
Looking for more information? Get in touch with us at geninfo@bseacd.org