District’s Current Drought Status: Stage 3 Exceptional Drought
The District remains in Stage 3 Exceptional Drought as long-term rainfall deficits continue to affect groundwater conditions across Central Texas. The region is currently about 9 inches below its year-to-date rainfall average, with a cumulative rainfall deficit of 26 inches over the past three years. While conditions improved earlier in the year, sustained recharge is still needed to help groundwater levels, springflow, and streamflow recover.
Rainfall Recap
Austin’s warm fall continued in October the average temperature was 74°F, 2.4°F above normal, making it the 14th-warmest October on record. Camp Mabry recorded 3.1 inches of rainfall, and Austin – Bergstrom International Airport (ABIA) received 2.1 inches. The two stations averaged about 2.6 inches, roughly 1.5 inches below the long-term October average, ranking as the 53rd-wettest October on record (Figure 1 and Figure 2).
Elsewhere in the Hill Country, Manchaca and San Marcos received about 2.8 inches, and Wimberley received about 3.3 inches.
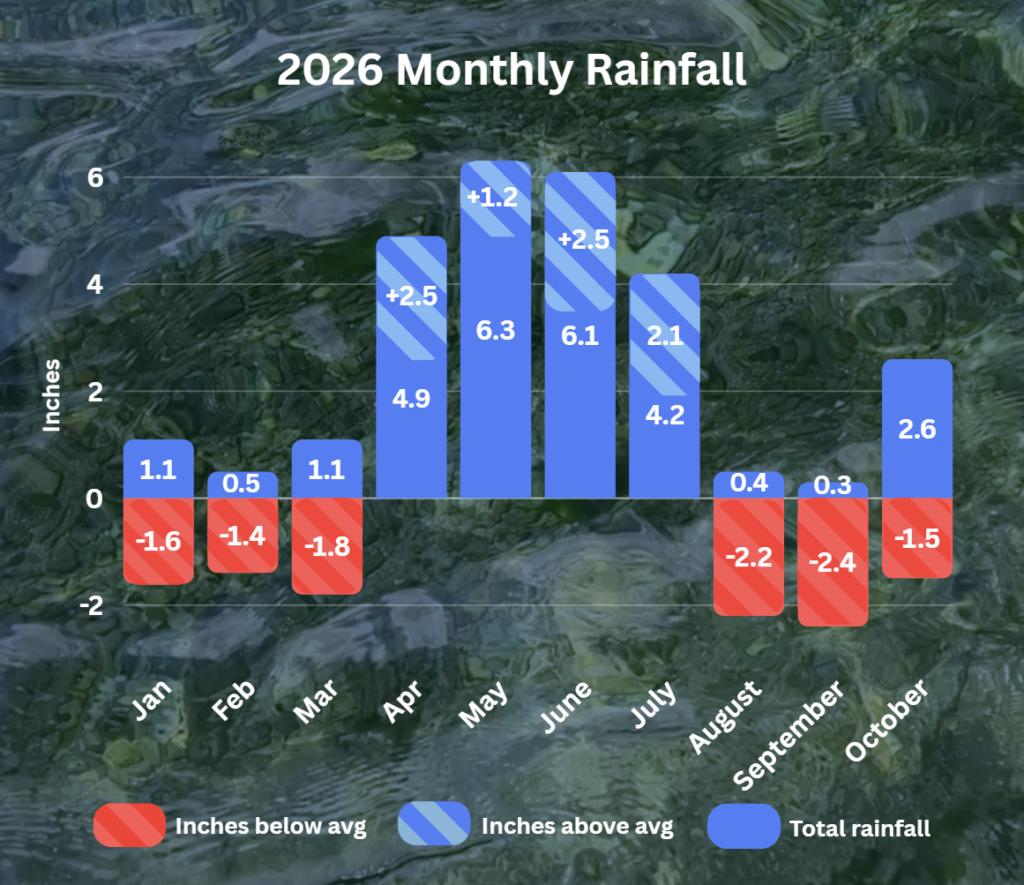
Figure 1. Monthly deviation from average and monthly total rainfall in District’s territory for 2026.
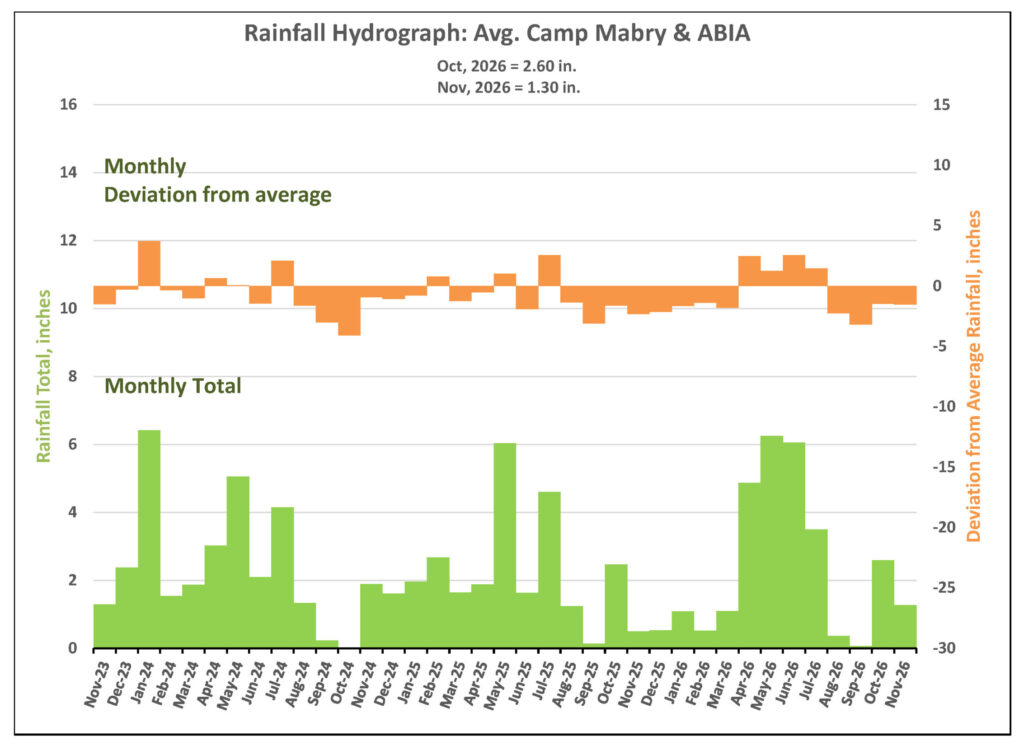
Figure 2. Monthly deviation from average and monthly total rainfall in District’s territory.
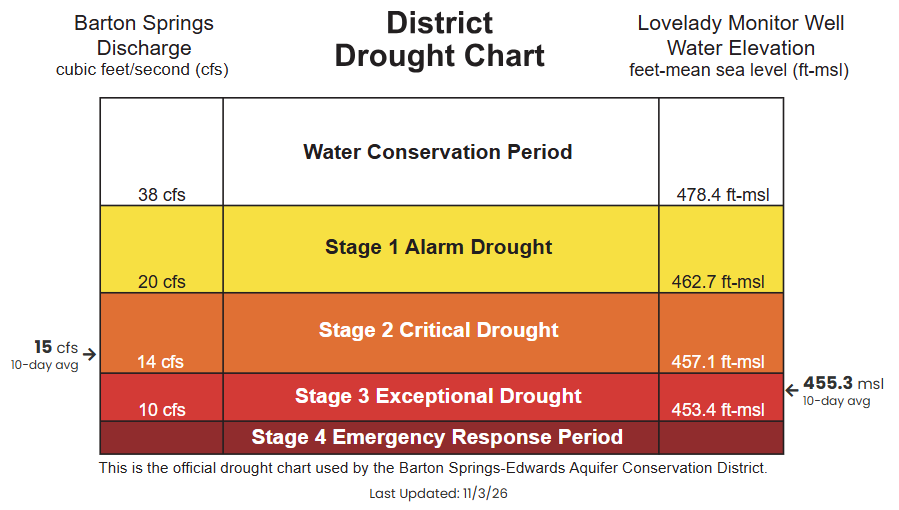
Figure 3. District drought chart showing the 10-day averages for Barton Springs flow and Lovelady monitor well water levels.
Barton Springs Flow
As of November 5, the 10-day average discharge at Barton Springs was 15 cubic feet per second (cfs) (Figure 4). Dry soils likely absorbed much of the early-October rainfall, limiting recharge to the aquifer. Rainfall later in the month appears to have helped keep springflow steady.
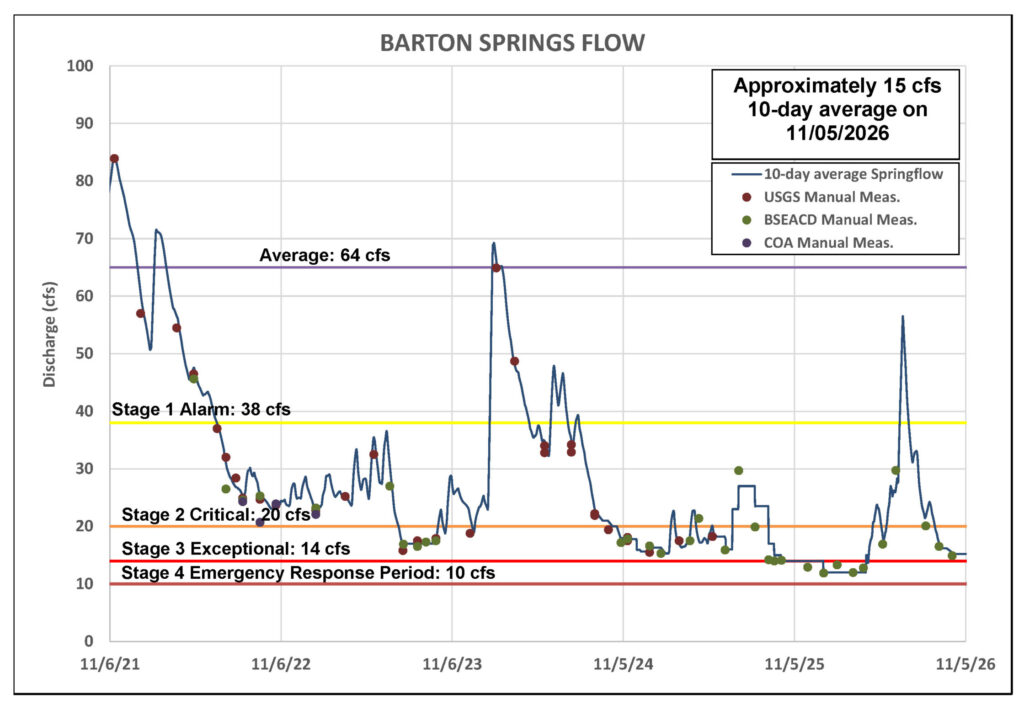
Figure 4. Barton Springs flow for the last five years.
*Note: Recent data for Barton Springs looks blockier than earlier, smoother records because it’s based on the average of two recent manual measurements, rather than continuous USGS gauge data.
Lovelady Monitor Well
As of November 5, the 10-day average water level at the Lovelady Monitor Well was 455.3 feet above mean sea level (ft-msl), approximately 1 foot lower than reported last month. Lovelady remains within the Stage 3 Exceptional Drought range, just 1.9 feet above the Stage 4 Emergency Response threshold of 453.4 ft-msl (Figure 5). Water levels have continued to decline by approximately 1 foot per month since August. If below average rainfall and this pace continues, Lovelady could reach the Stage 4 Emergency Response threshold in early 2027.
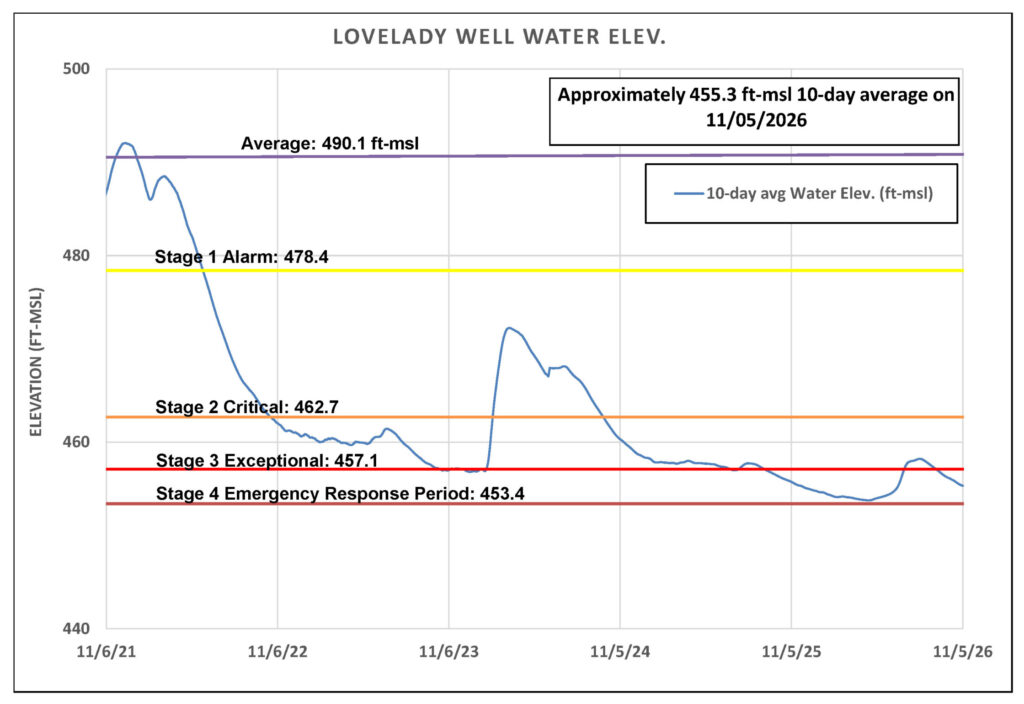
Figure 5. Lovelady monitor well water-level elevation.
Trinity Aquifer
Groundwater levels in the Trinity Aquifer continue to decline. The decline at the Lowe-Coronado Middle Trinity monitor well has slowed, likely in response to the early October rainfall (Figure 6). The Upper Trinity Aquifer shows a similar trend.
Surface-water conditions track the same pattern. Jacobs Well Spring has remained at zero flow since mid-August. The Blanco River at Wimberley rose briefly after early October rainfall, then dropped back to 4-6 cfs, remaining well below normal.
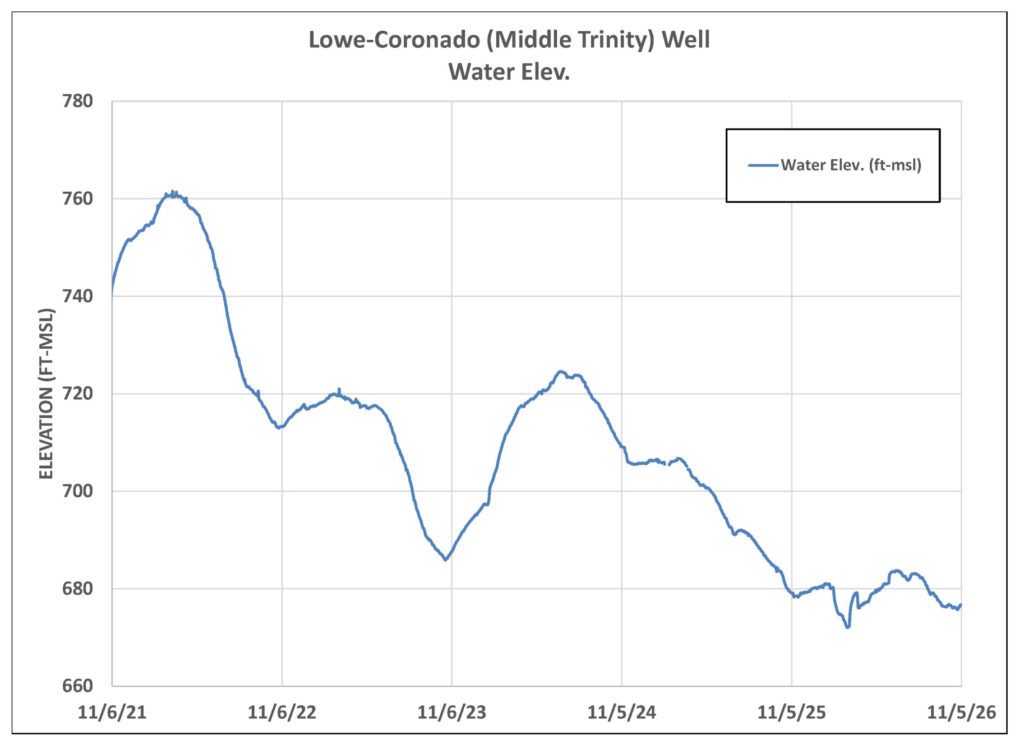
Figure 6. Lowe-Coronado (Middle Trinity) Monitor Well Water-level elevation.
Outlook
October rainfall helped green up the landscape across Central Texas, but it did little to replenish the aquifer or improve groundwater conditions.
Looking ahead, November is typically Austin’s fifth-wettest month, averaging about 2.9 inches of rain. Rainfall so far in November has averaged 1.3 inches. The Climate Prediction Center’s three-month outlook favors above-average rainfall through the end of 2026 (Figure 7). Sustained, well-distributed rainfall will be important to support recovery in groundwater levels, springflow, and streamflow as we head into our driest months of the year.
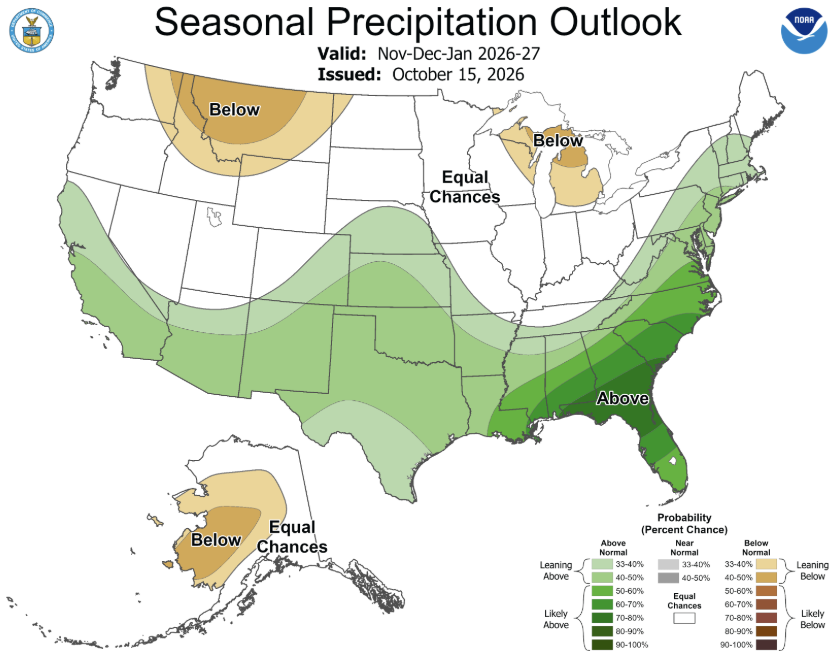
Figure 7. October-November-December Seasonal Precipitation Outlook for the US according to the climate Prediction Center.