Rainfall
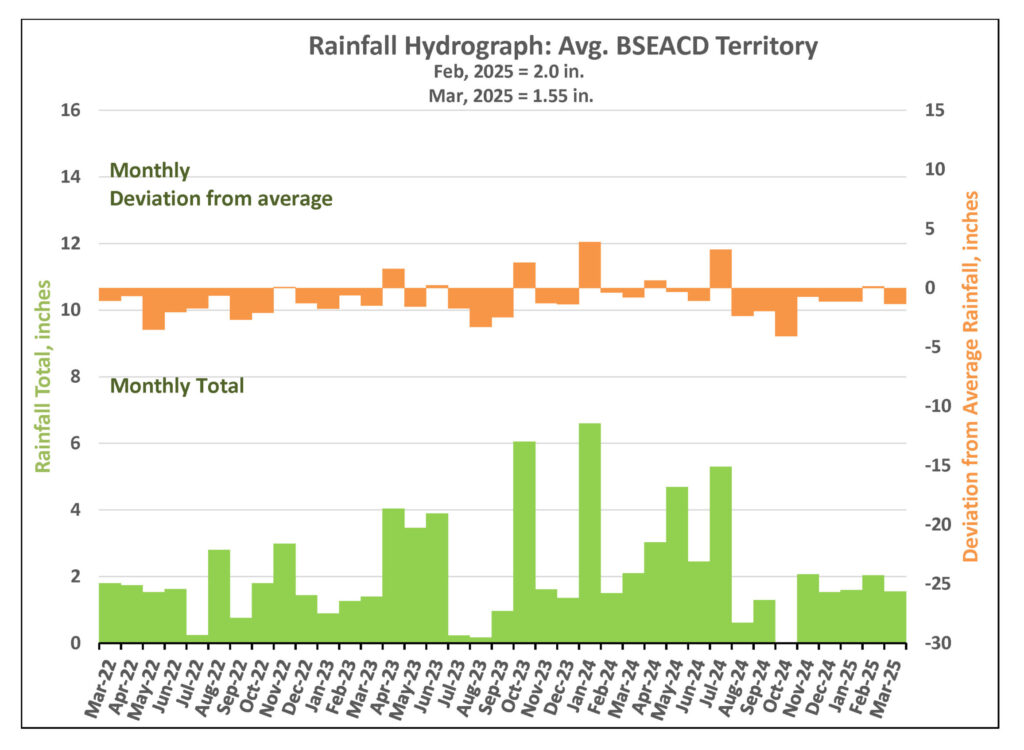
In March, the District’s territory received an average of 1.55 inches of rainfall, mostly in the latter half of the month (Figure 1). While this was 1.35 inches below the historical monthly average of 2.9 inches, the good news is that much of this rain fell over the Edwards and Trinity recharge zones—where the aquifers are exposed at the surface. Rain in these areas is especially valuable because it replenishes our groundwater resources more effectively.
Although this rainfall wasn’t enough to end drought conditions, it has kept the District in Stage III Drought—preventing the decline into Stage IV for now.
Drought Triggers and Status
Barton Springs Flow
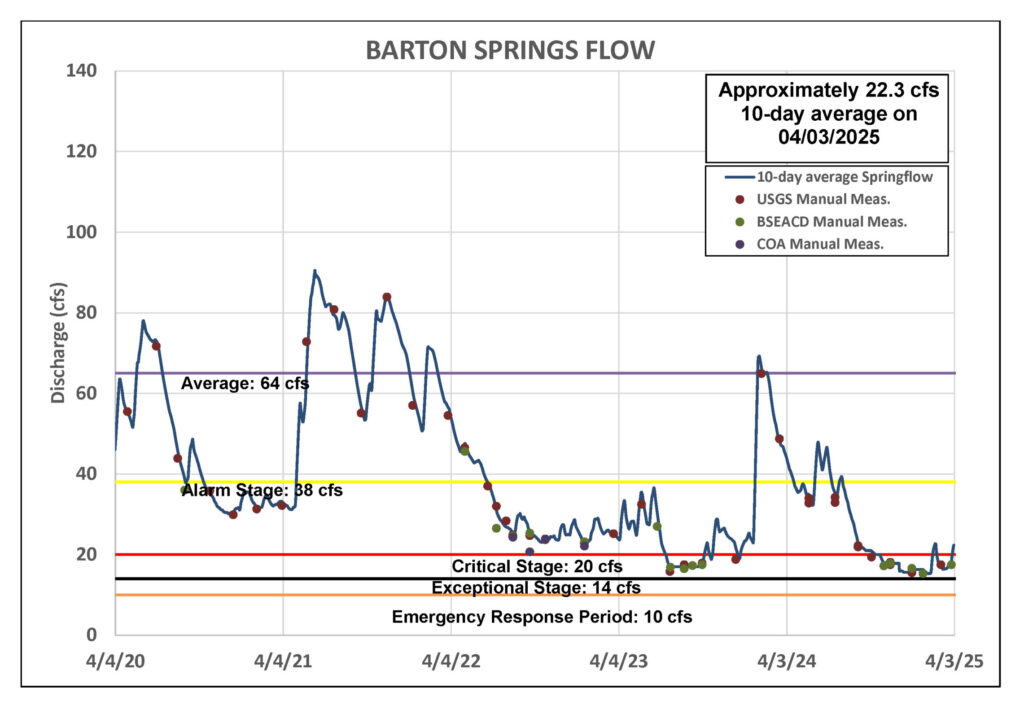
Similar to February, when spring flow levels nearly dropped to Stage IV, March rainfall arrived just in time to prevent a further decline. As a result, Barton Springs’ flow increased, peaking at 28 cubic feet per second (cfs). While this rainfall wasn’t nearly enough to pull us out of drought, it has temporarily slowed worsening conditions—at least for now—before Texas enters its dry season.
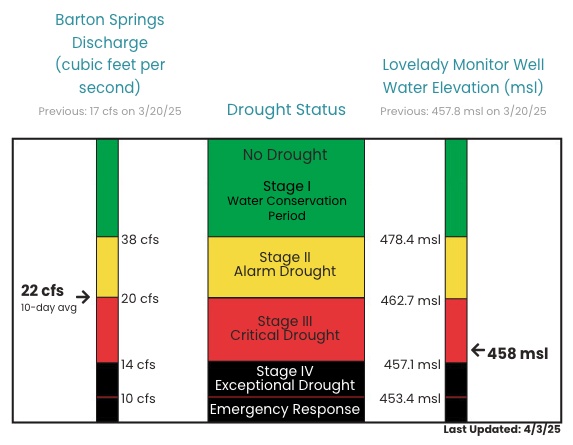
As of April 3, the 10-day average flow at Barton Springs stands at 22 cfs (Figure 2). This value is based on the most recent manual measurement taken by District staff on March 20, 2025, combined with data from the USGS gauge. The next manual measurement is scheduled for mid-April.
Lovelady Monitor Well
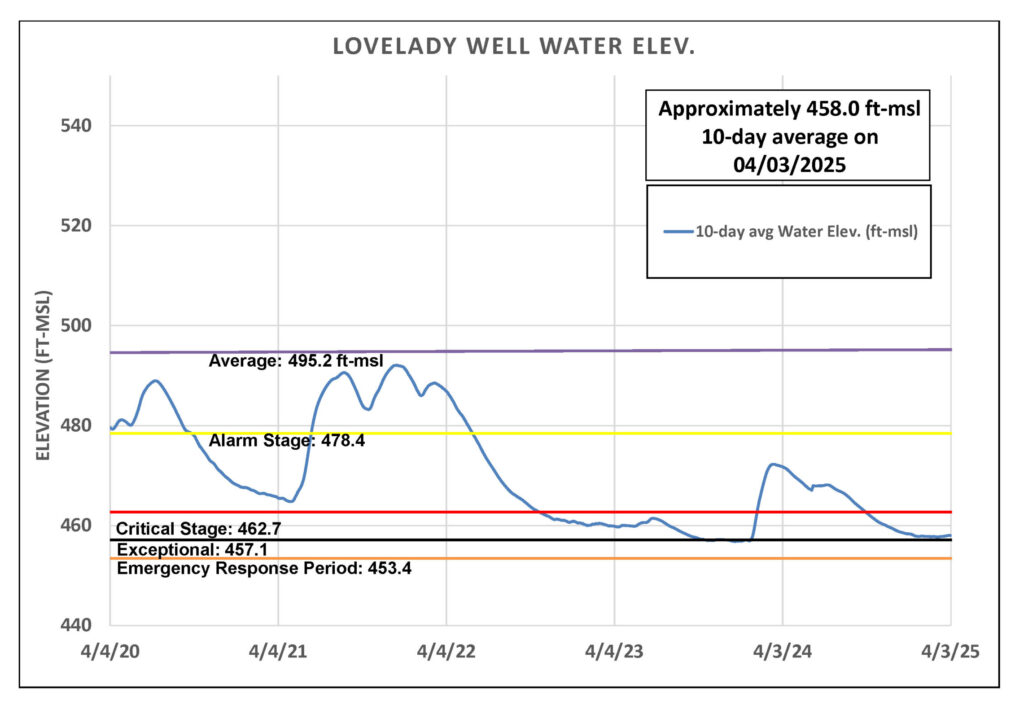
On April 3, the 10-day average water level at the Lovelady monitor well was recorded at 458.0 feet above mean sea level (ft-msl), placing it within the District’s Stage III threshold and just 0.9 feet above the Stage IV Exceptional Drought (Figure 3). As is typical for the Lovelady well, water levels responded to February’s rainfall with a delayed but temporary boost, first stabilizing before a slight rise. Though the increase was subtle, it reinforces the theme that “every bit helps.” Water levels have since resumed a downward trend and without additional rainfall, Lovelady could drop into Stage IV by mid-May.
Trinity Aquifer
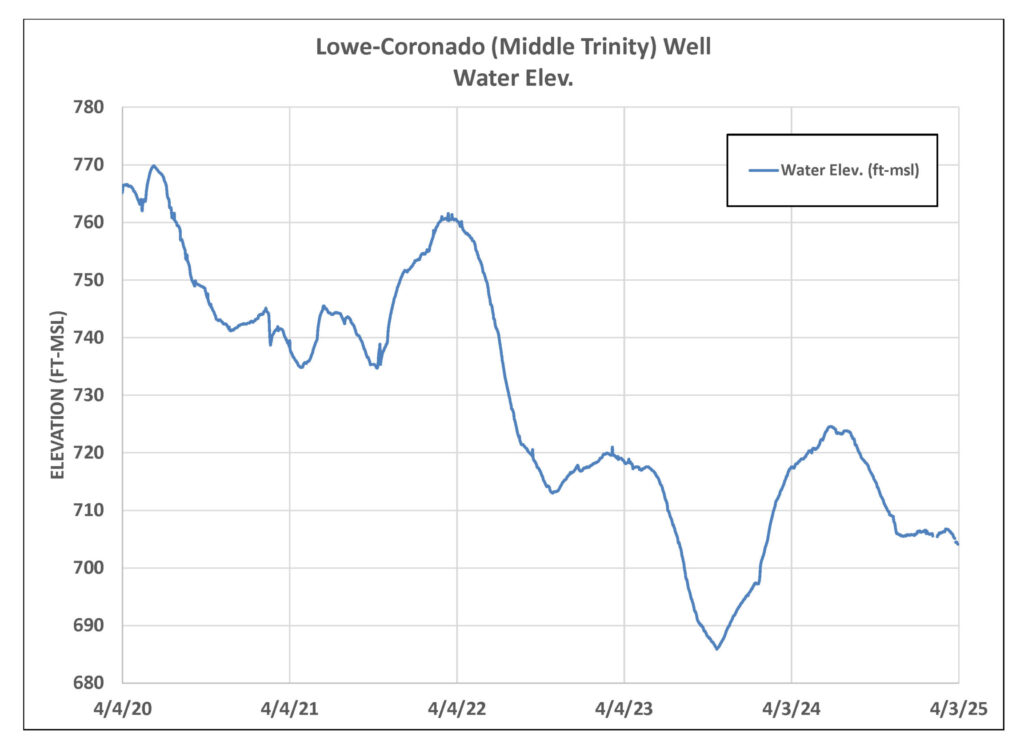
The water level in the Lowe-Coronado Middle Trinity monitor well, located in the Rolling Oaks neighborhood in Driftwood, had remained mostly stable and flat-lined from mid-November 2024 until mid-March when levels have begun to decline (Figure 4).
Since February’s rains brought a dramatic surge to Jacob’s Well Spring (JWS), briefly pushing its flow to a yearly high of 16 cfs, flows have rescinded back to below 1.5 cfs. Meanwhile, the Blanco River at Wimberley gauge has maintained a steady flow of 8 to 9 cfs – a range that has remained consistent since mid-November 2024.
