Rainfall
After experiencing a generous average of 6 inches of rainfall in October that saturated the ground and contributed to some aquifer recharge, the Texas Hill Country has reverted to below-average conditions in November. The area has only recorded 1.4 inches, which is 1.5 inches below the historical average. Specifically, Camp Mabry to ABIA region received approximately 1.2 inches, Buda to Wimberley averaged 1.4 inches, and San Marcos received around 1.7 inches.
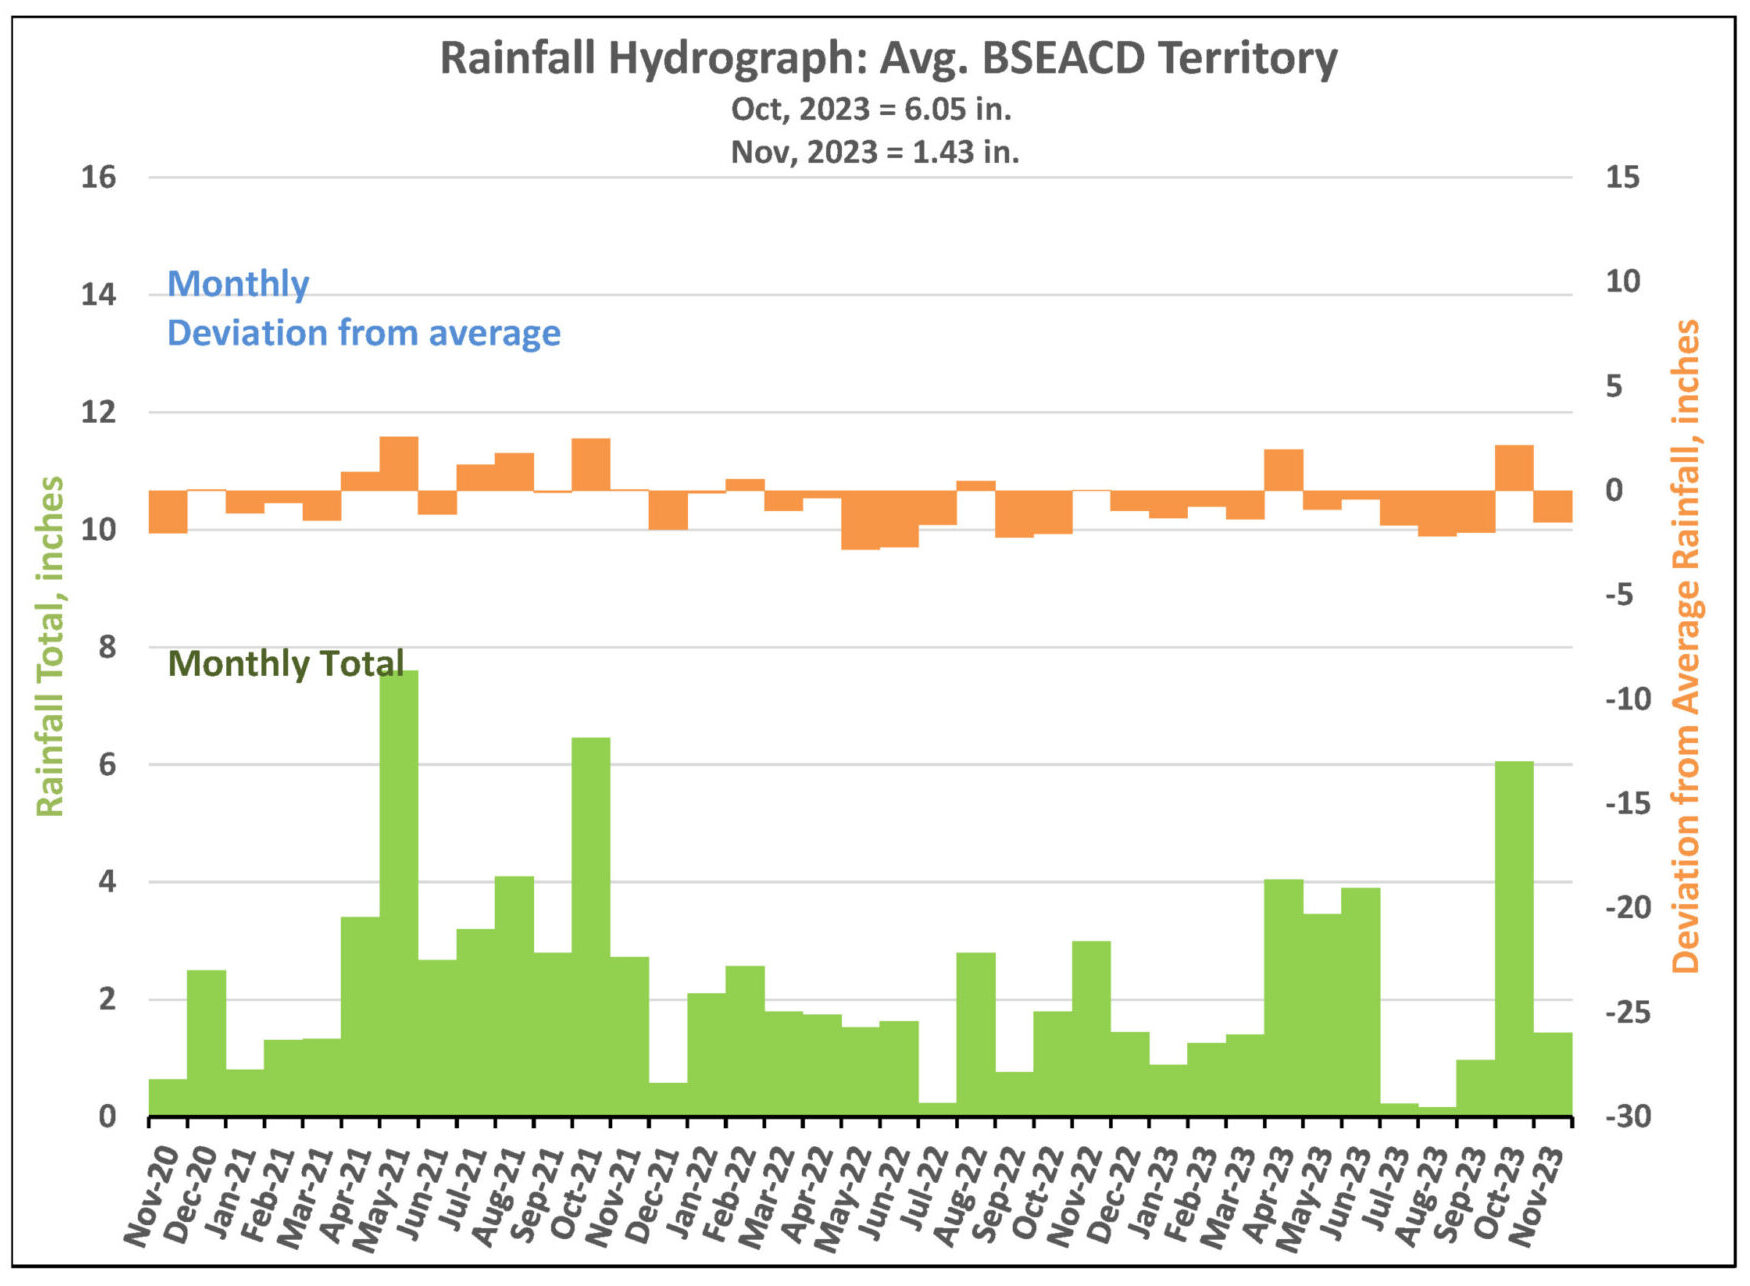
Figure 1. Monthly deviation from average and monthly total rainfall in District’s territory.
Barton Springs Flow
As of November 30, the 10-day average reading from the real-time USGS gauge at Barton Springs indicates a flow of 24 cubic feet per second (cfs). The rainfall in late October and early November led to an elevated flow at the springs, reaching a peak of 38 cfs. This small amount of recharge lifted the flow above the 17 cfs level, where it had predominantly remained throughout the summer and fall (Figure 2). BSEACD staff will conduct a manual field measurement in mid-December to verify the accuracy of the USGS gauge reporting.
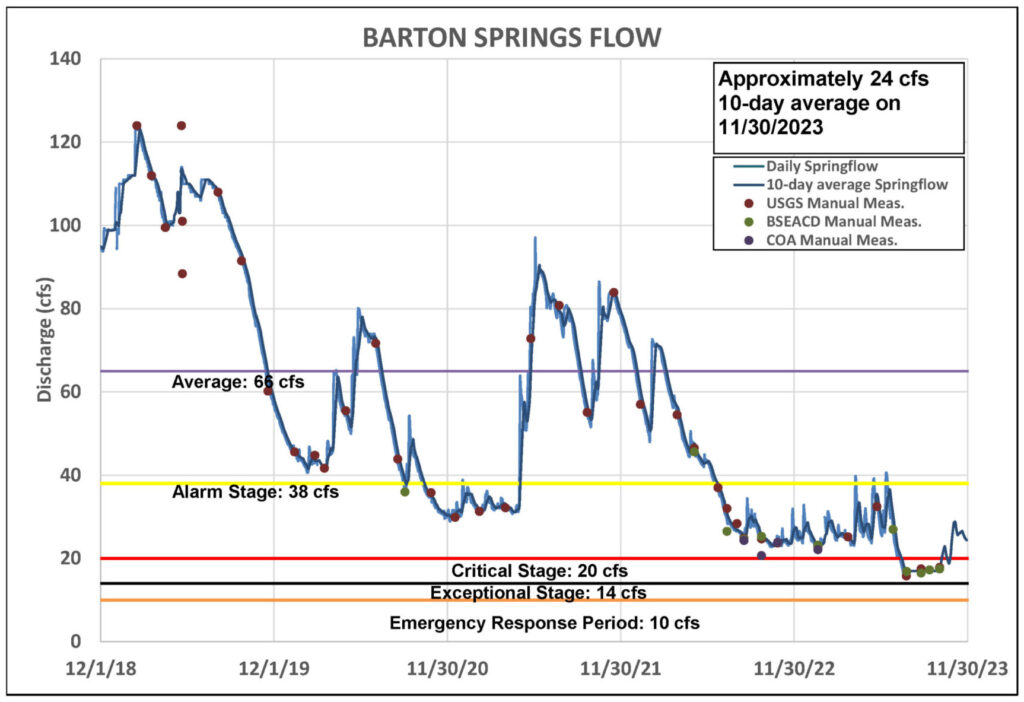
Figure 2. Barton Springs flow for the last five years.
Lovelady Monitor Well
On November 30, 2023, the Lovelady well recorded a 10-day average water level of 457.1 feet above mean sea level (ft-msl), which is teetering right at the District’s Stage IV Exceptional Drought threshold (Figure 3). Without additional rainfall, there is a looming possibility that levels could dip into Stage IV in the near future.
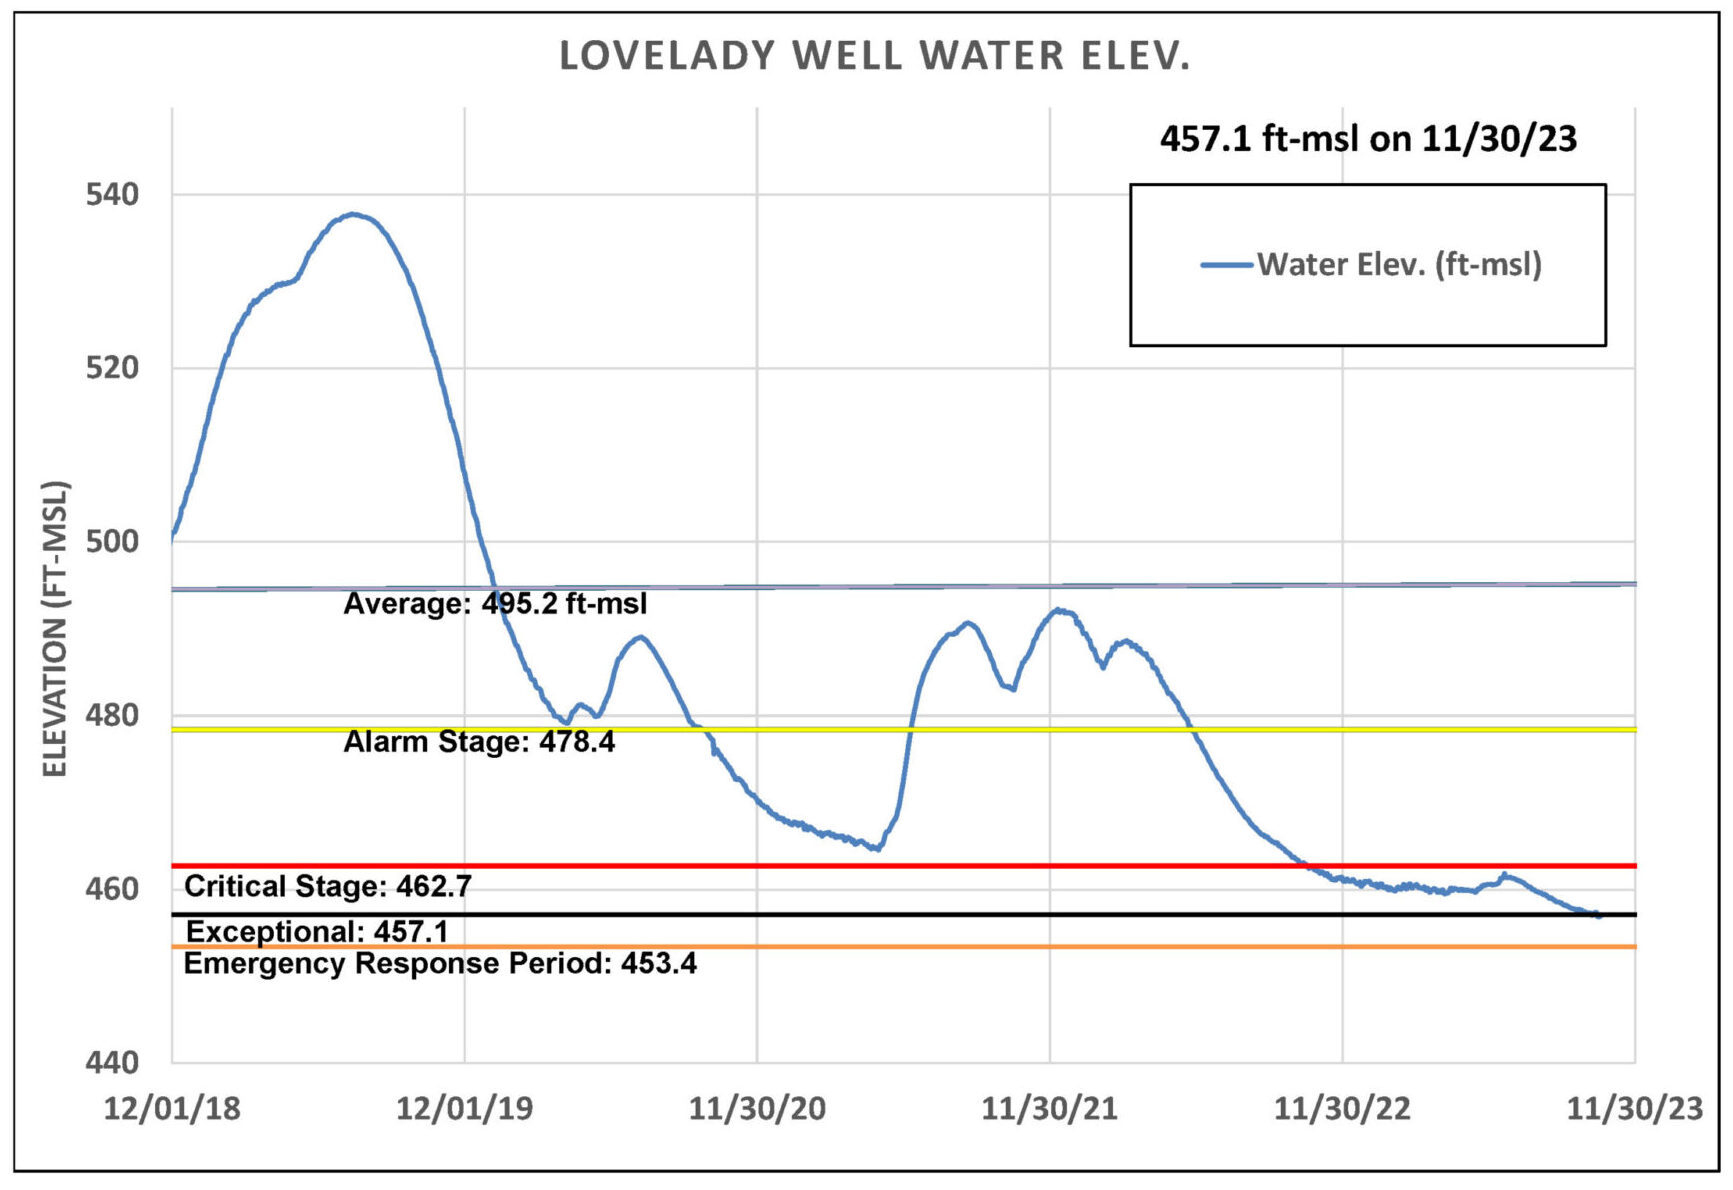
Figure 2. Lovelady groundwater level over the last five years.
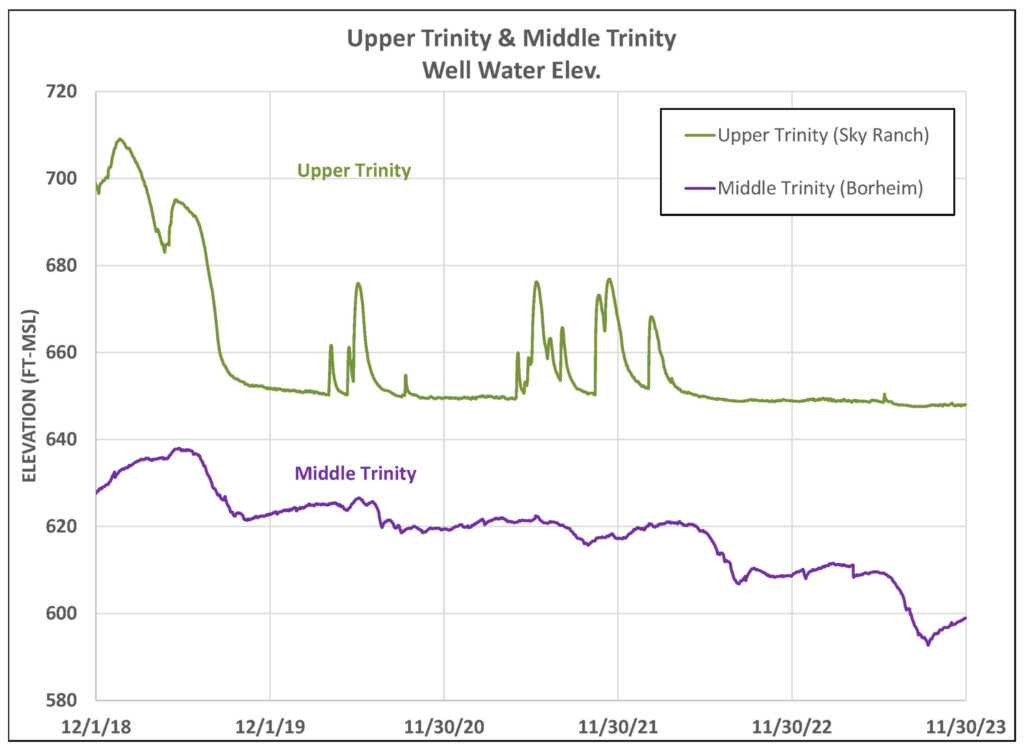
Upper and Middle Trinity
Following the October rainfall, there has been little to no rise in water levels in the Upper Trinity Aquifer (green), while the Middle Trinity (purple) has displayed a positive response (Figure 4). The flow gauge at Jacob’s Well spring recorded zero flow after a brief surge following the late October rains. Additionally, the Blanco River at Wimberley has seen increased flows this fall, representing an improvement from the summer.
Predictions
Meteorological winter begins December 1 and continues through the end of February. The National Center for Atmospheric Research is now predicting a Super El Niño this winter – the first since 2016. El Niño events are categorized by Niño 3.4 index. This metric is a measure of average sea surface temperatures in a certain area of the tropical Pacific Ocean. If this is forecasted to be more than 1.12 degrees Fahrenheit above average, it’s categorized as a Super El Niño. Similar conditions in the winter of 1997-1998 resulted in 10.22” of rain throughout the season– nearly three inches above the historical average of 7.25”.