The District is in Stage 3 Exceptional Drought, which took effect October 1, 2025.
District drought conditions are determined by two key indicators: springflow at Barton Springs and groundwater levels at the Lovelady monitor well. If either of these sites fall below their set drought threshold, the District can declare a deeper drought stage. To exit a drought stage, however, both indicators must raise above their respective thresholds.
This page provides the latest drought status, real-time data for Barton Springs flow and Lovelady groundwater levels, along with additional drought resources from throughout the area.
District Drought Chart and Status
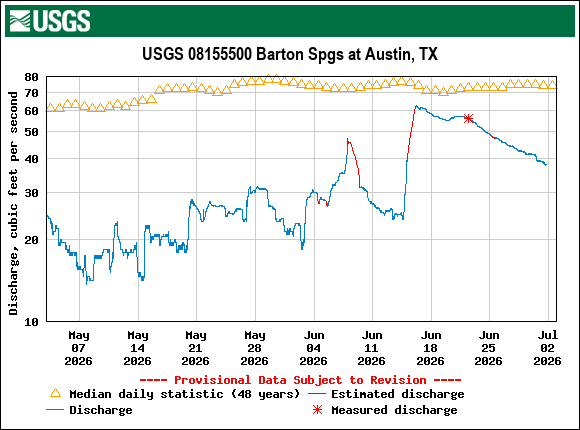
48 cfs 10-day avg
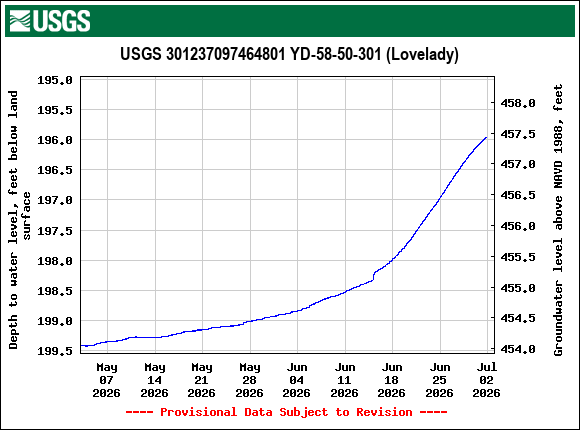
456.8 msl 10-day avg
Last Updated: 7/1/26
Barton Springs Flow in cubic feet per second (cfs)
Note: The U.S. Geological Survey (USGS) operates a real-time gauge that monitors Barton Springs flow. To ensure accuracy, USGS staff manually measure flow every 4-8 weeks to calibrate the gauge, with District staff often assisting. During very low flows (below 20 cfs), gauge readings can be affected by pool operations such as plugging dam outflows to maintain pool levels; manual measurements during these periods provide the most accurate flow data.
Lovelady Groundwater Level in feet above mean sea level (ft-msl)
Pumpage Reductions
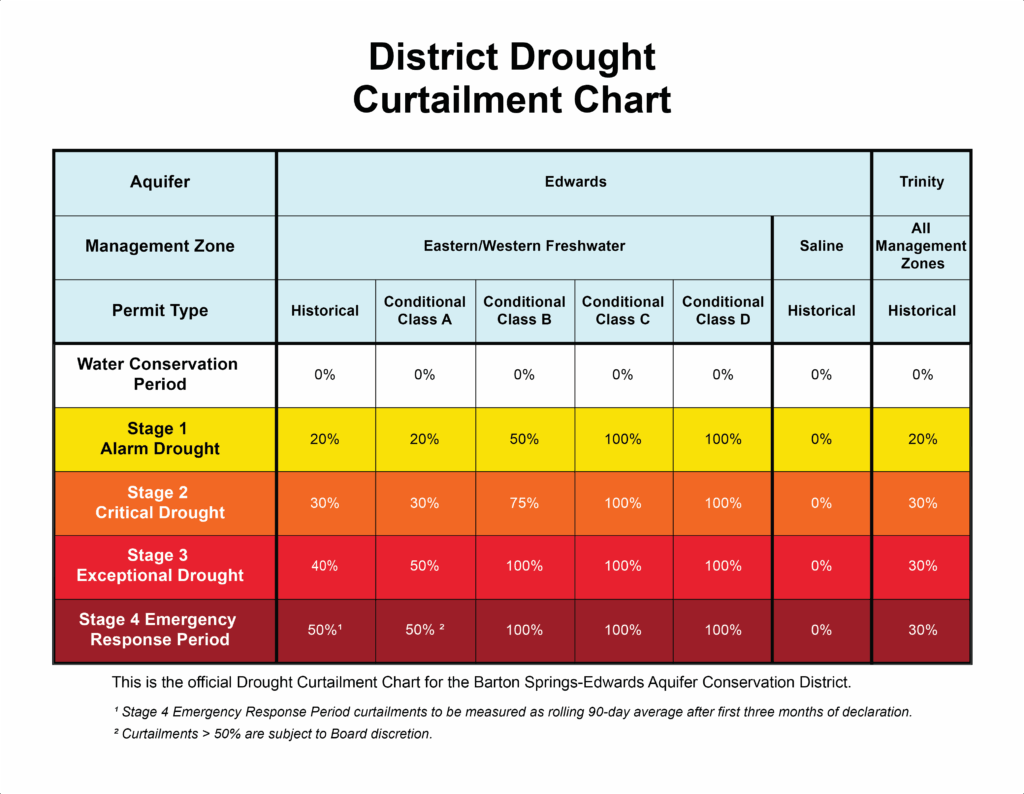
Stage 3 Exceptional drought requires all District permittees to implement mandatory measures specified in their User Drought Contingency Plans (UDCPs) to meet monthly pumpage reduction requirements including:
30% for Trinity and Alluvial/Austin Chalk Historical permittees
40% for Edwards Historical permittees
50% for Conditional Class A permittees
100% for Edwards Conditional Class B, C and D permittees
If you need a copy of your UDCP, please contact Erin Swanson at eswanson@bseacd.org.
Customers served by water utilities on groundwater wells, such as City of Kyle, Creedmoor Maha WSC, and City of Buda, are required to comply with their water provider’s restrictions. For additional information, please contact them directly.
Additional Resources
Here are additional District and external resources related to the ongoing drought in Central Texas.